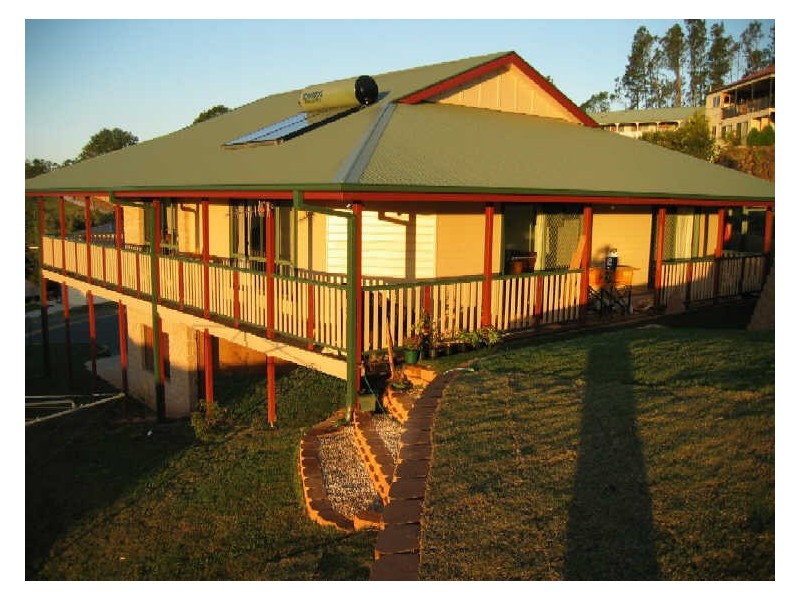
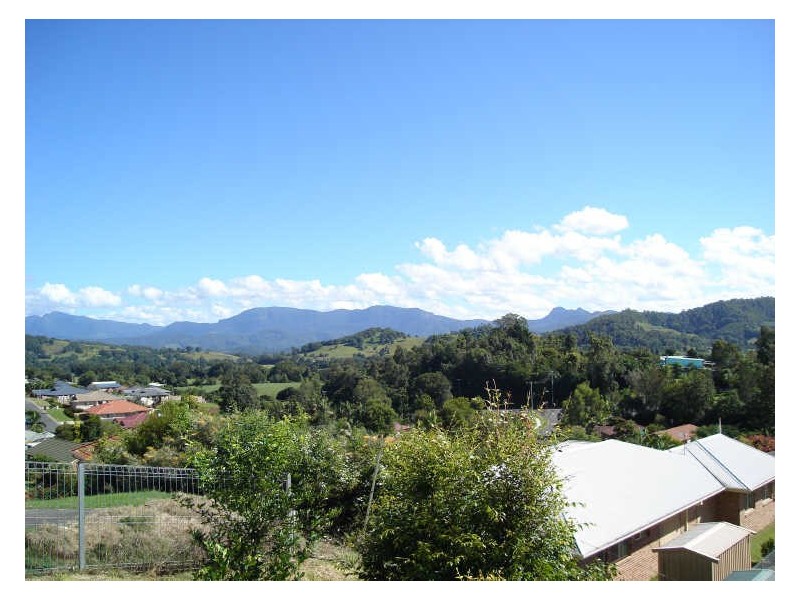
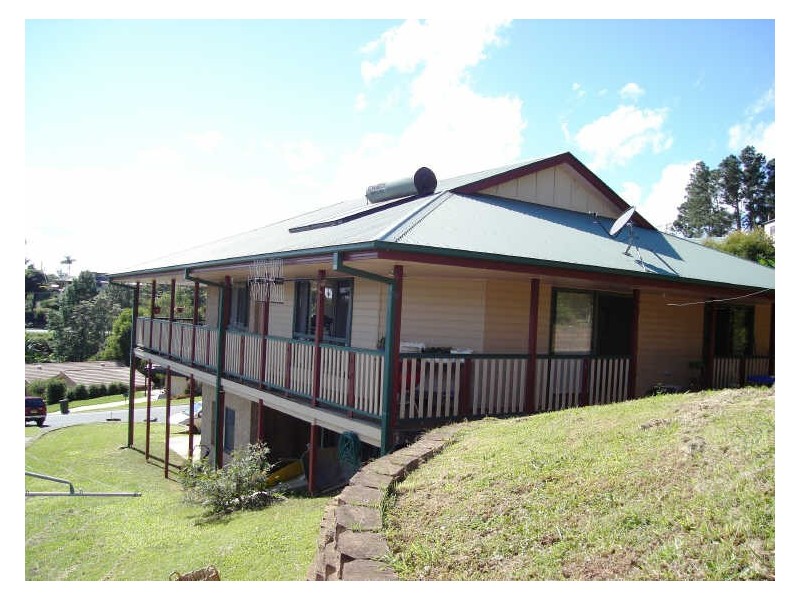
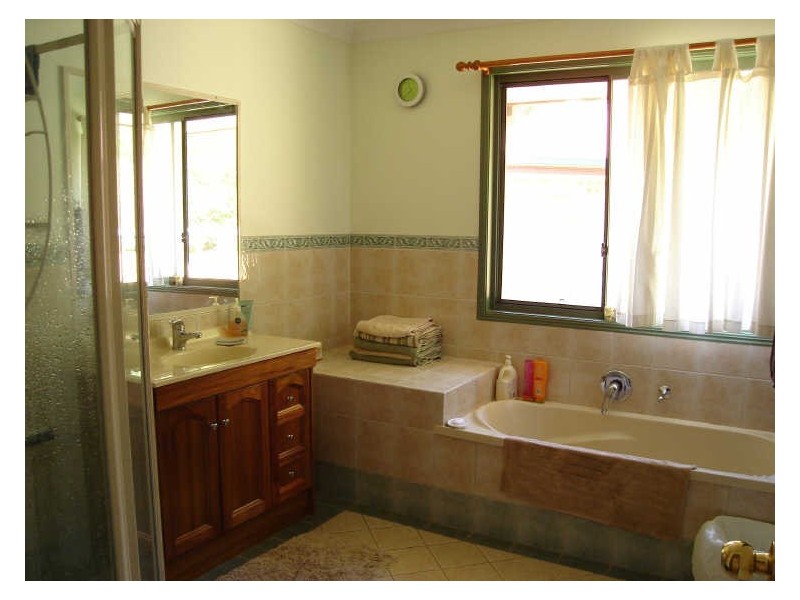
22 McPherson Ct, Murwillumbah NSW 2484 PERCHED HIGH ON THE HILL! $469,000 Listing history: 27 Sep, 2010 3 1 2 Listing ID: 5521676 Other properties for sale near 22 McPherson Ct, Murwillumbah NSW 2484 2/17 McPherson Court, Murwillumbah NSW 2484 8 Barnby Street, Murwillumbah NSW 2484 2/17 McPherson Court, Murwillumbah NSW 2484 22 McPherson Court, Murwillumbah NSW 2484 1/7 McPherson Court, Murwillumbah NSW 2484 Location THIS PROPERTY WAS WITHDRAWN Enquiry about this property Name* Email* Phone* Message* Send me regular newsletters from Homehound Have agents get in touch about similar properties within the area What is 8 + 20?* Receive email alerts for properties like this Email alerts Email* Send me regular newsletters from Homehound. Have agents get in touch about similar properties within the area What is 8 + 20?*