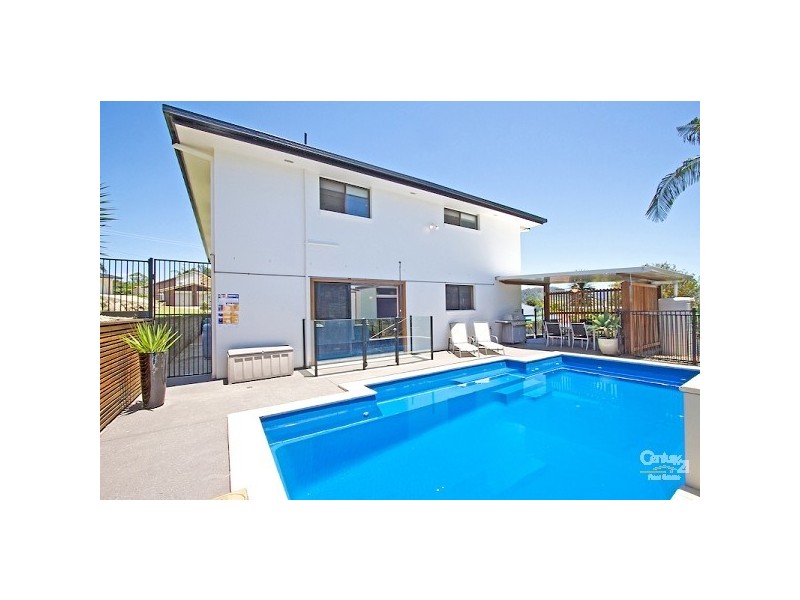
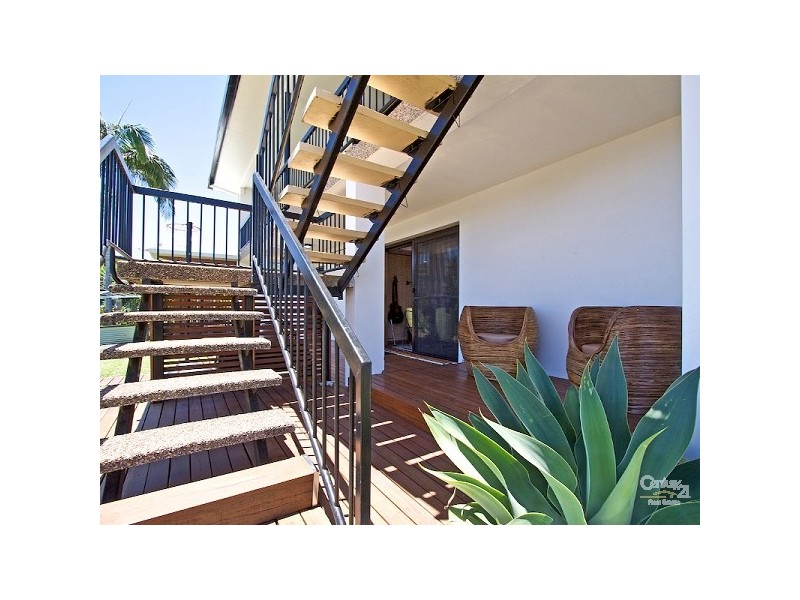
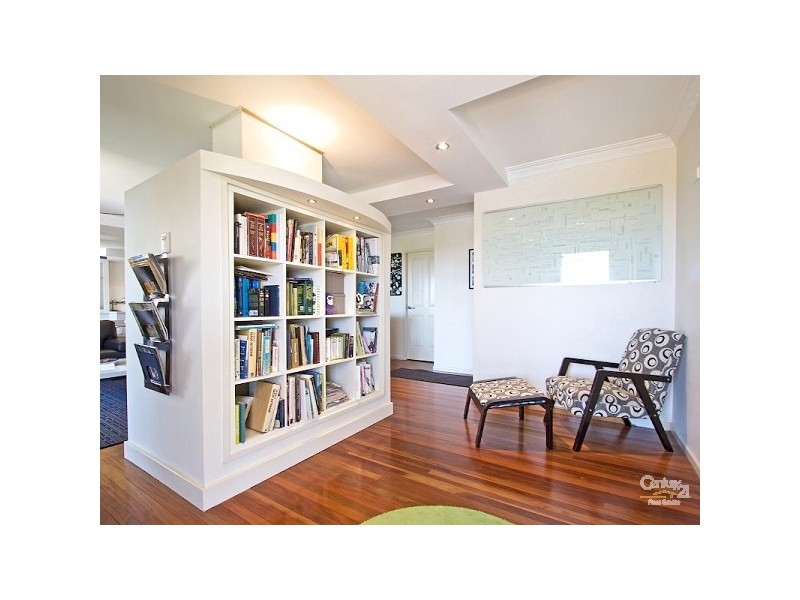
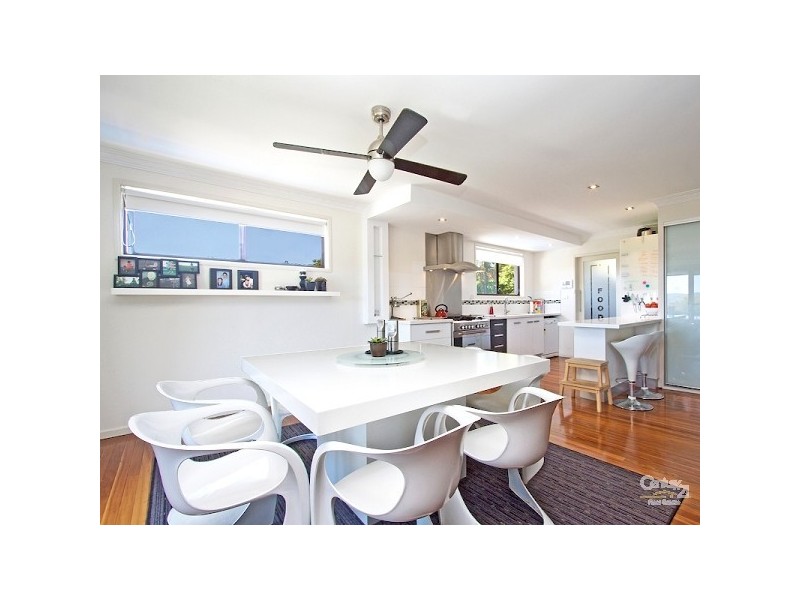
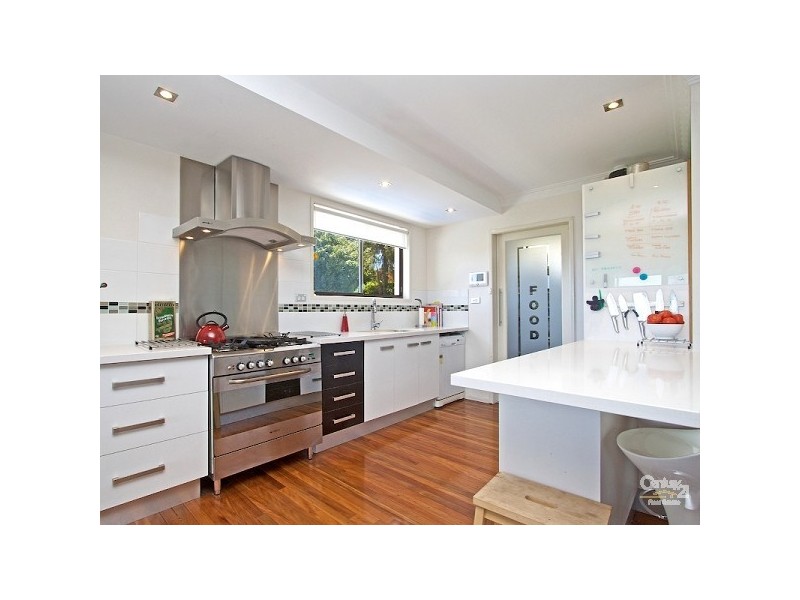
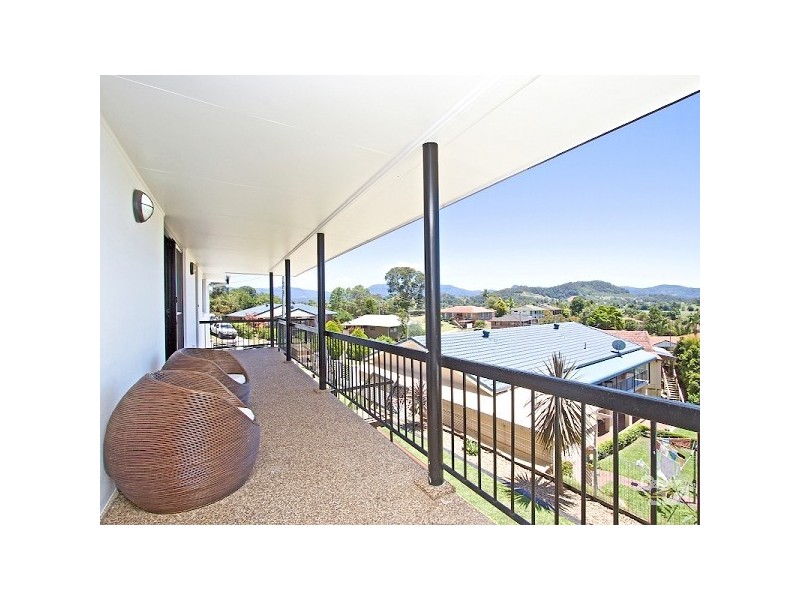
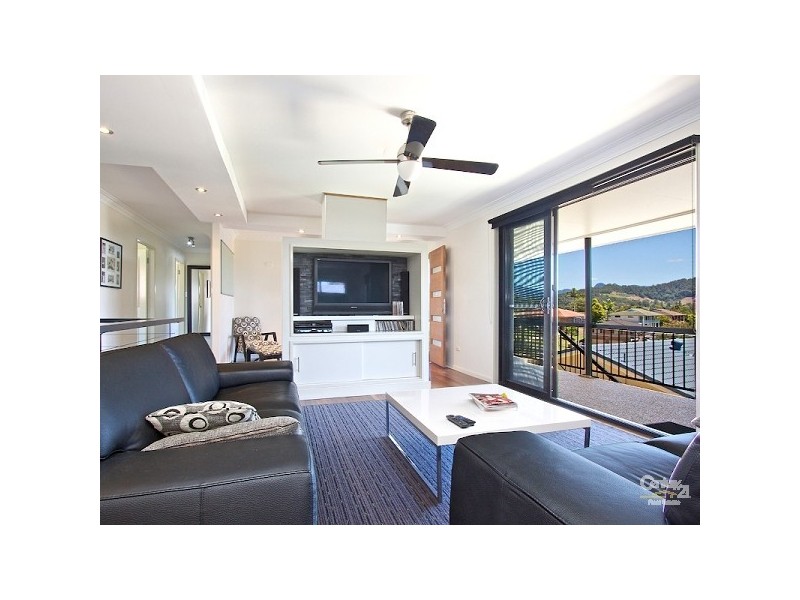
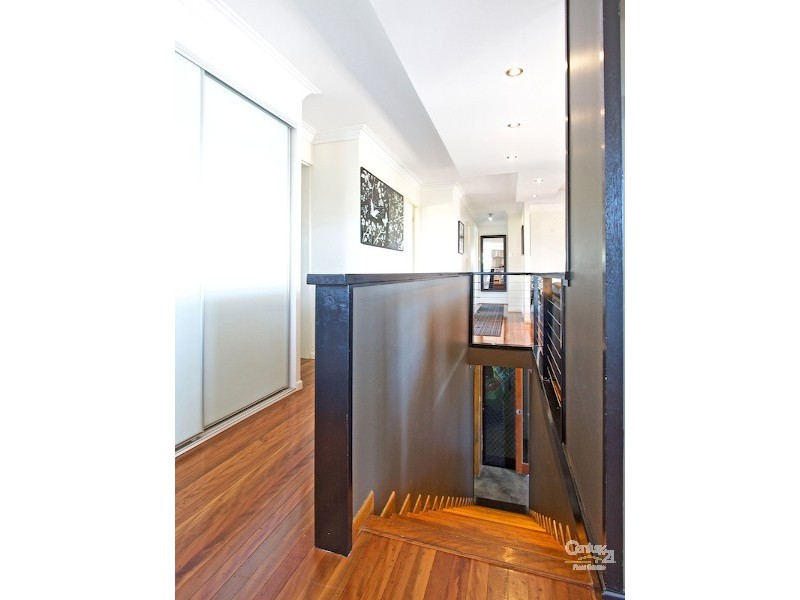
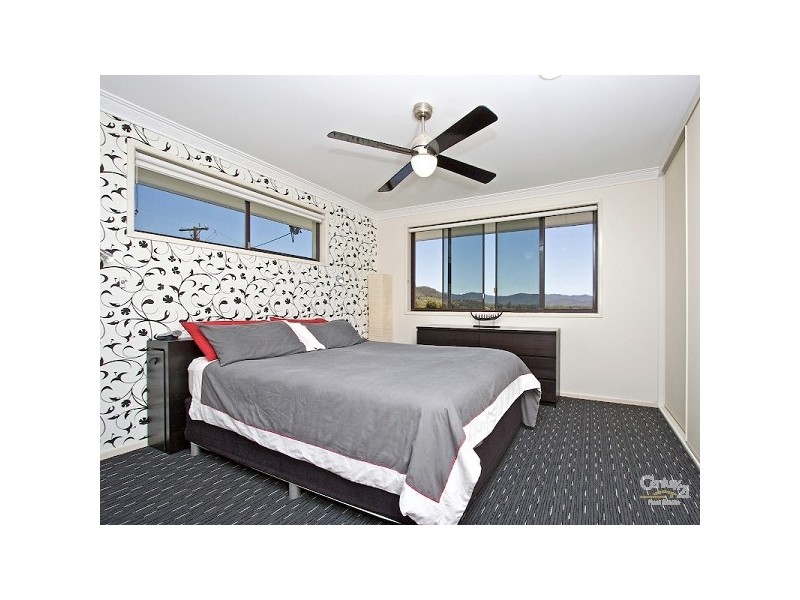
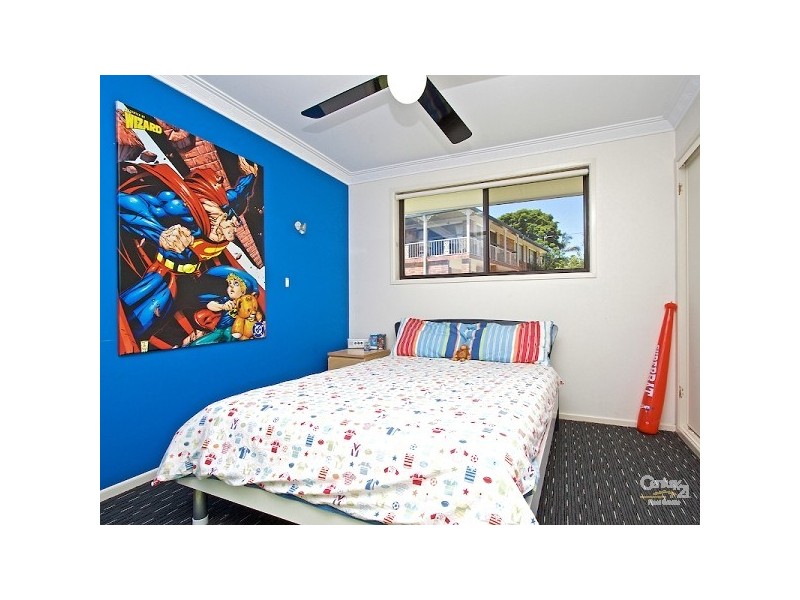
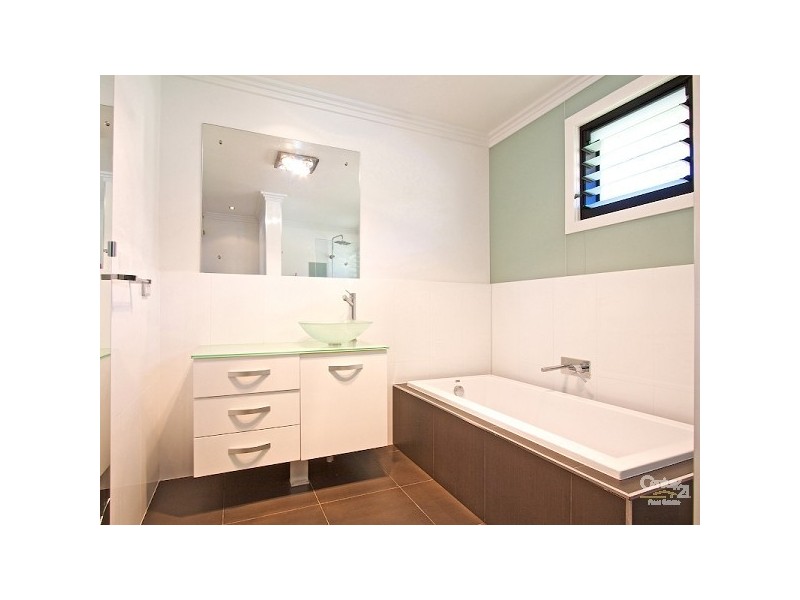
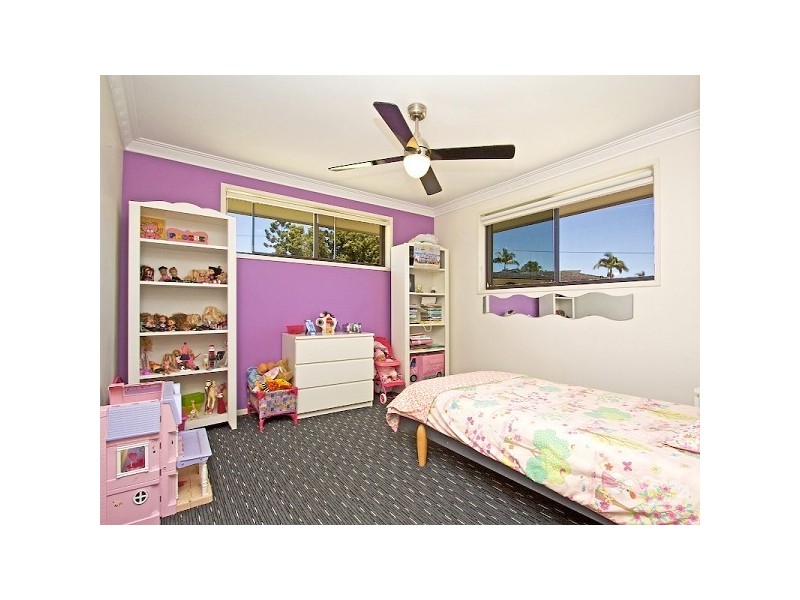
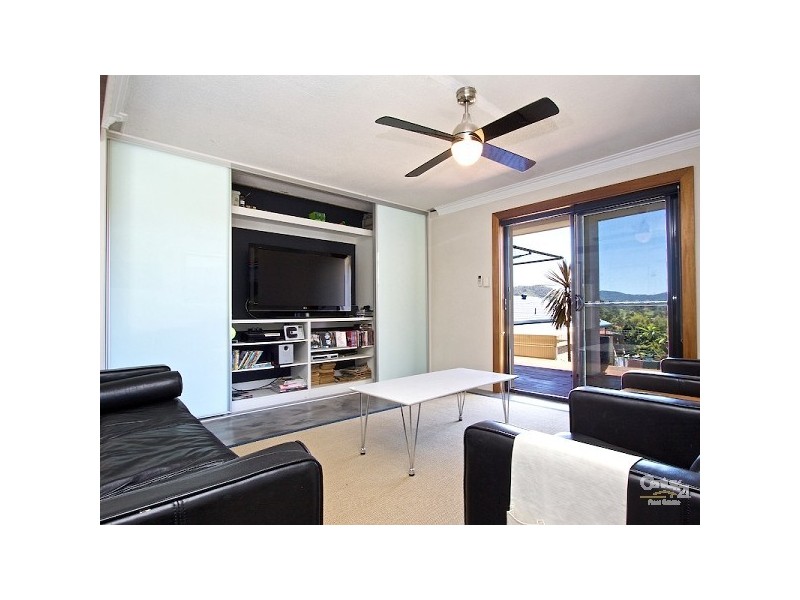
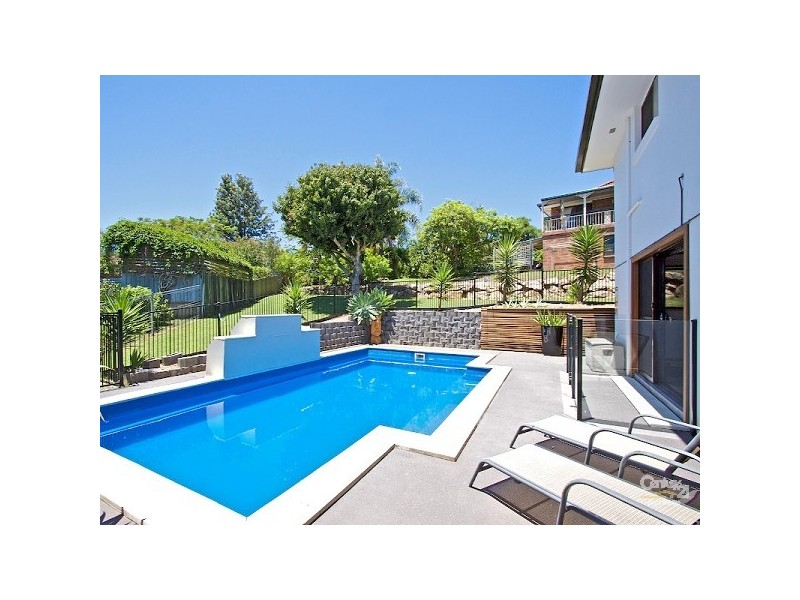
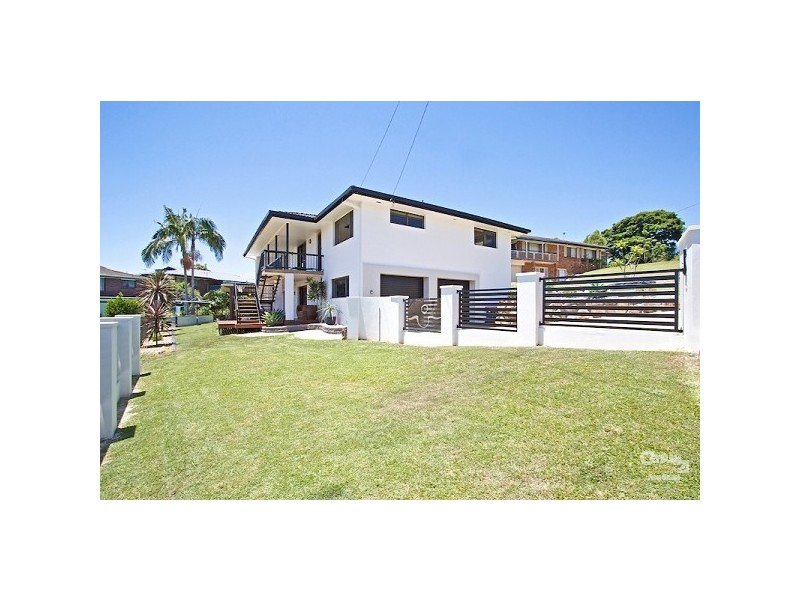
There are approximately 18,049 people living in Murwillumbah but… who are they?
44
49%
51%
Suburb Stats
$834/WK
$250/WK
$382/WK
Value of property in Murwillumbah and nearby suburbs
Murwillumbah
South Grafton
Gulmarrad
Nymboida
Average Home Price$479,070Average Rental Price$346Household Size2.5
Average Home Price$271,720Average Rental Price$291Household Size2.4
Average Home Price$494,664Average Rental Price$1,136Household Size2.4
Average Home Price$315,036Average Rental Price$434Household Size2.4
Water Useper year per person
0.6mln. litres
State Average 0.74 mln. litres
Nat. Average 0.74 mln. litres
Greenhouse Pollutionper year per person
16.48tonnes
State Average 19.31 tonnes
Nat. Average 20.3 tonnes
Dwelling Types
91%
5%
3%
Most Common Suburb Professions
17% Professio…
15% Technicia…
14% Managers…
12% Labourers…
Nearby schools: mt st patrick college, murwillumbah high school, murwillumbah east primary school, murwillumbah community college
Nearby cafes: cenzo cafe, the blue frog, king street cafe, dabelles cafe
Nearby doctors: king street medical centre-dr alan secombe, main street medical centre, king street medical centre-dr yabsley robyn, king street dental practice
Nearby hospitals: murwillumbah district hospital, queen street medical centre, king street medical centre