Listing ID: 14139228
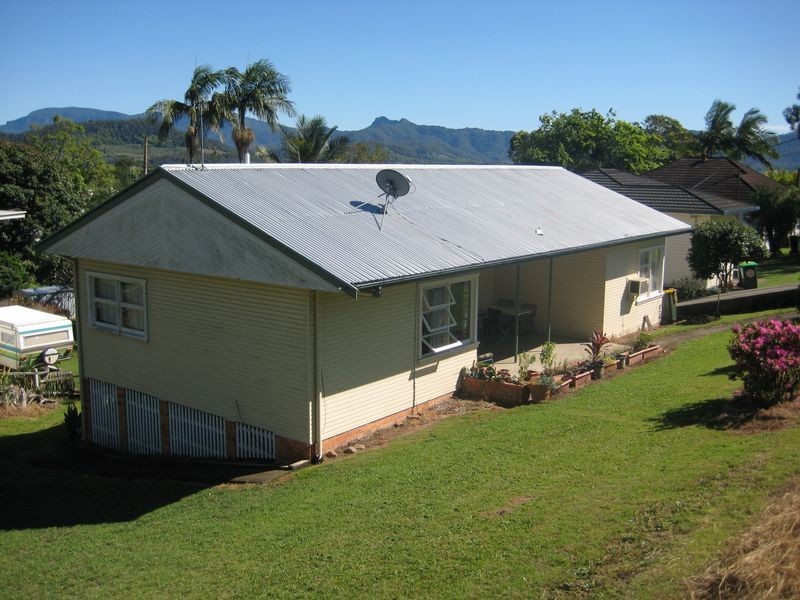
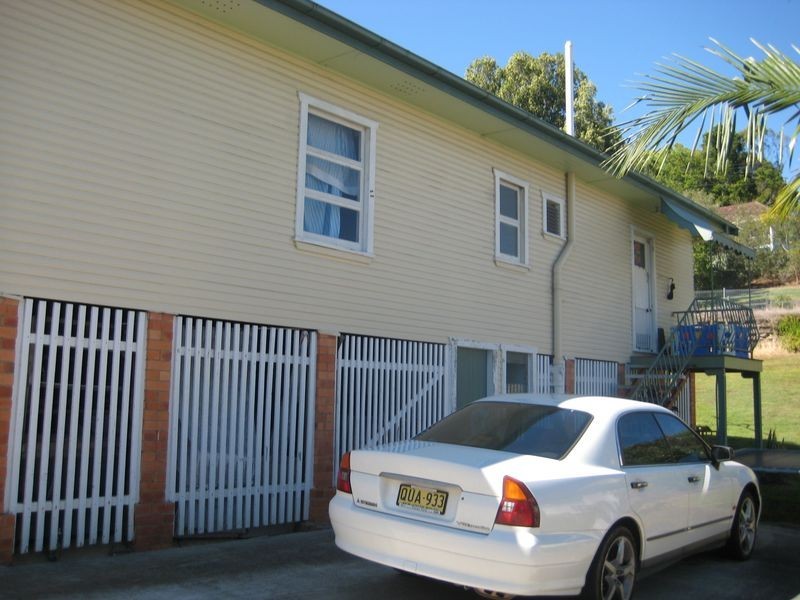
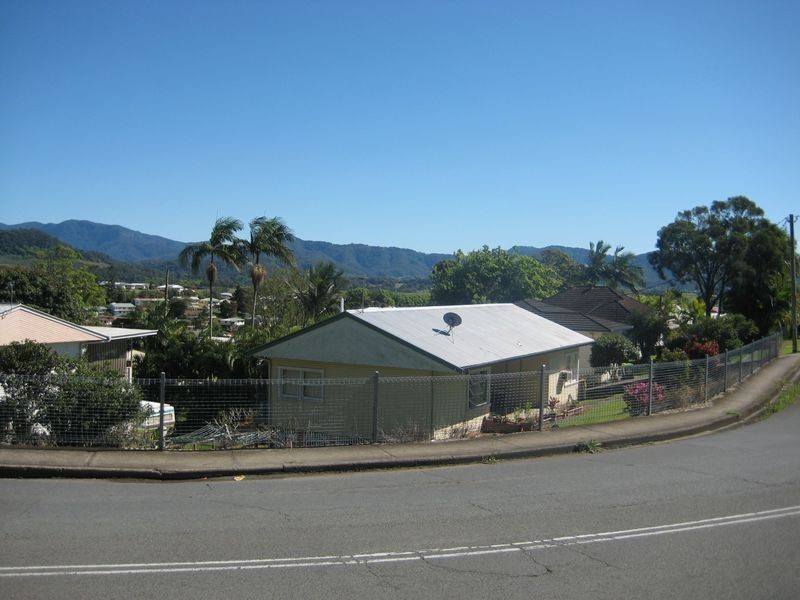
89 Byangum Road, Murwillumbah NSW 2484
YOUR CHANCE TO GET INTO THE MARKET
$285,000
- Listing history:
- 18 Jan, 2011
- 21 Jan, 2011
- 26 Jan, 2012
- 22 Mar, 2012

- 3
- 1
- 0
YOUR CHANCE TO GET INTO THE MARKET


Listing ID: 14139228