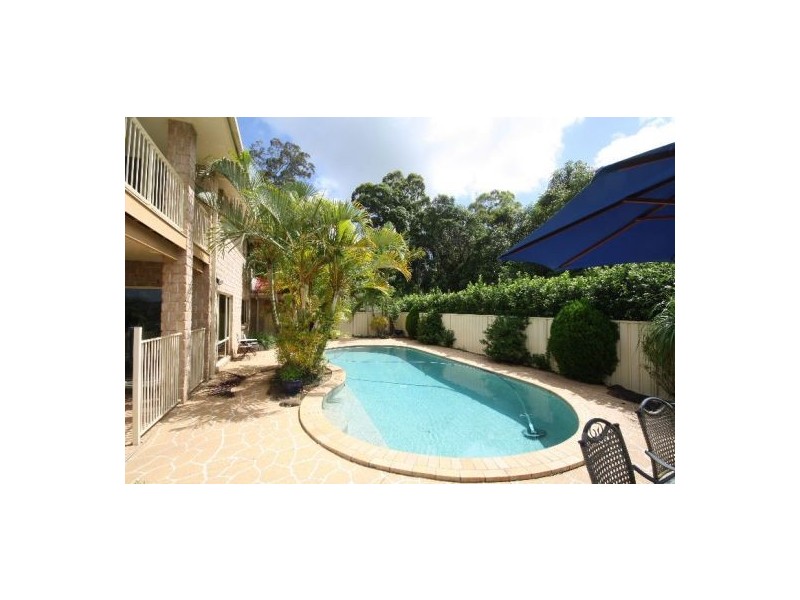
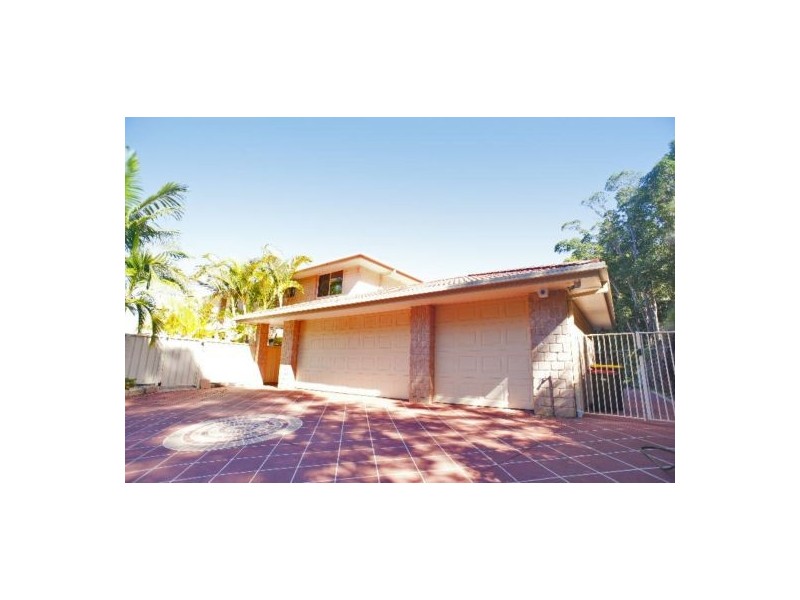
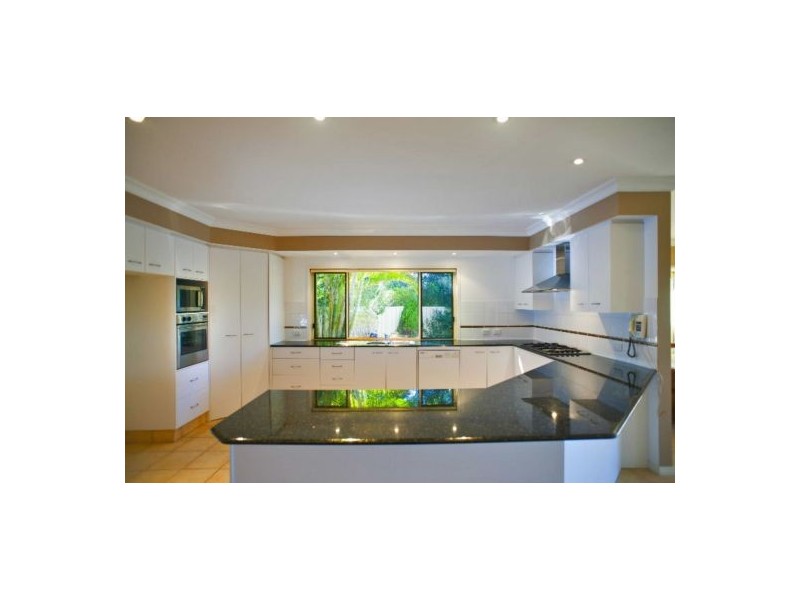
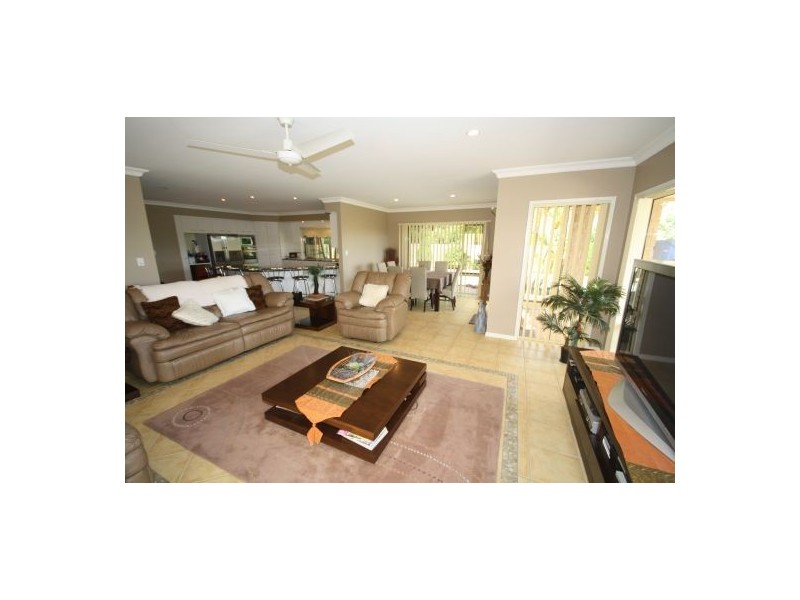
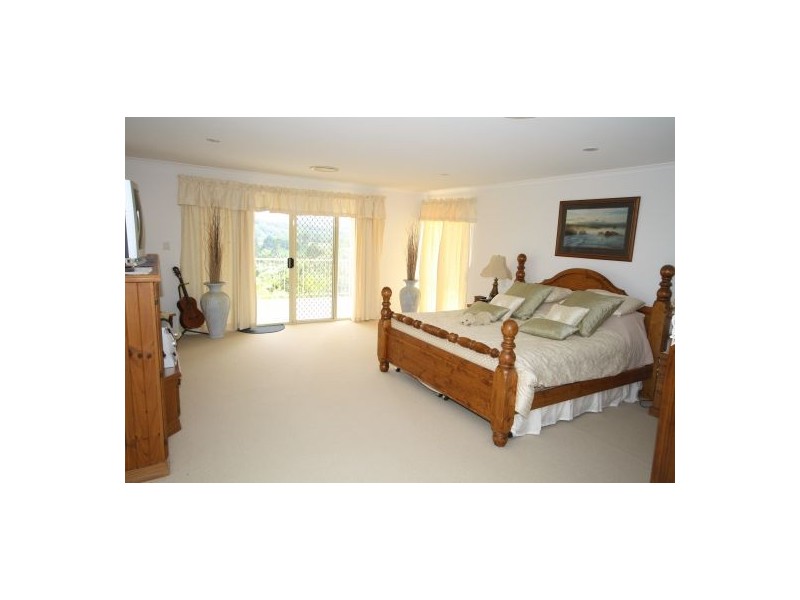
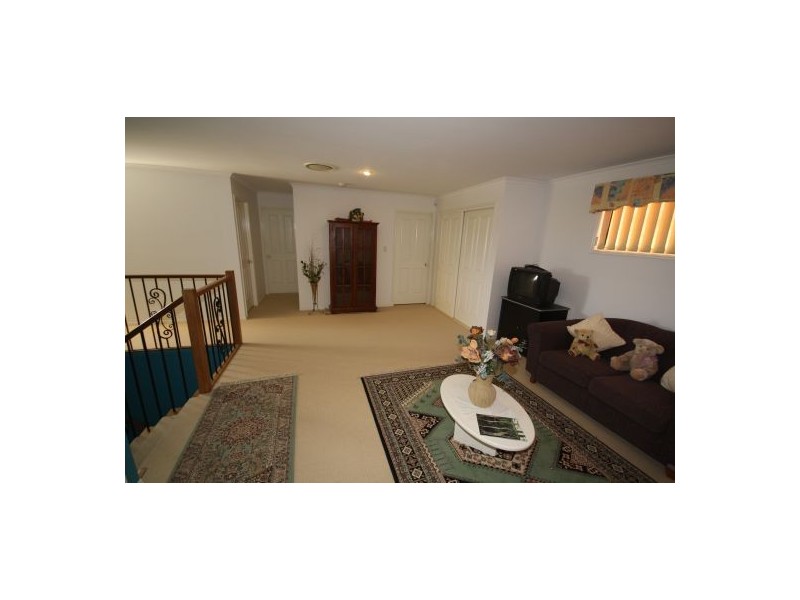
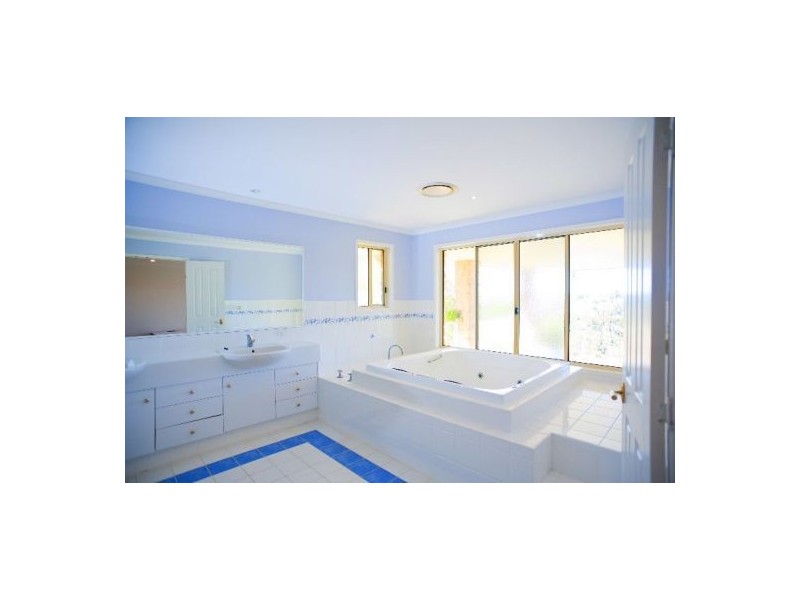
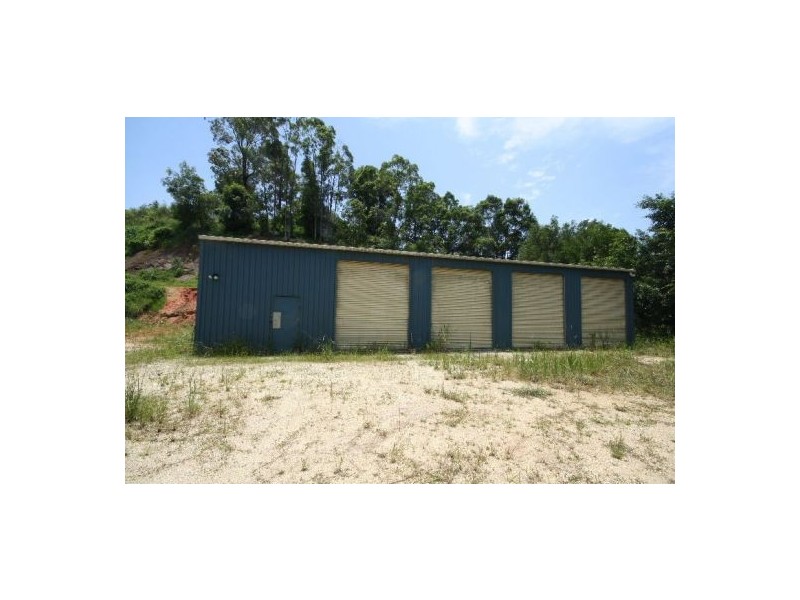
There are approximately 18,049 people living in Murwillumbah but… who are they?
44
49%
51%
Suburb Stats
$834/WK
$250/WK
$382/WK
Value of property in Murwillumbah and nearby suburbs
Murwillumbah
Burringbar
Kingscliff
Clunes
Average Home Price$479,070Average Rental Price$346Household Size2.5
Average Home Price$722,921Average Rental Price$383Household Size2.4
Average Home Price$714,128Average Rental Price$483Household Size2.3
Average Home Price$681,874Average Rental Price$475Household Size2.4
Water Useper year per person
0.6mln. litres
State Average 0.74 mln. litres
Nat. Average 0.74 mln. litres
Greenhouse Pollutionper year per person
16.48tonnes
State Average 19.31 tonnes
Nat. Average 20.3 tonnes
Dwelling Types
91%
5%
3%
Most Common Suburb Professions
17% Professio…
15% Technicia…
14% Managers…
12% Labourers…
Nearby schools: murwillumbah high school, mt st patrick college, murwillumbah south infants school, murwillumbah community college
Nearby cafes: cenzo cafe, sugar beat cafe, the modern grocer, dabelles cafe
Nearby doctors: king street medical centre-dr alan secombe, main street medical centre, king street medical centre-dr john moran, advanced radiology clinics murwillumbah
Nearby hospitals: murwillumbah district hospital, queen street medical centre, king street medical centre