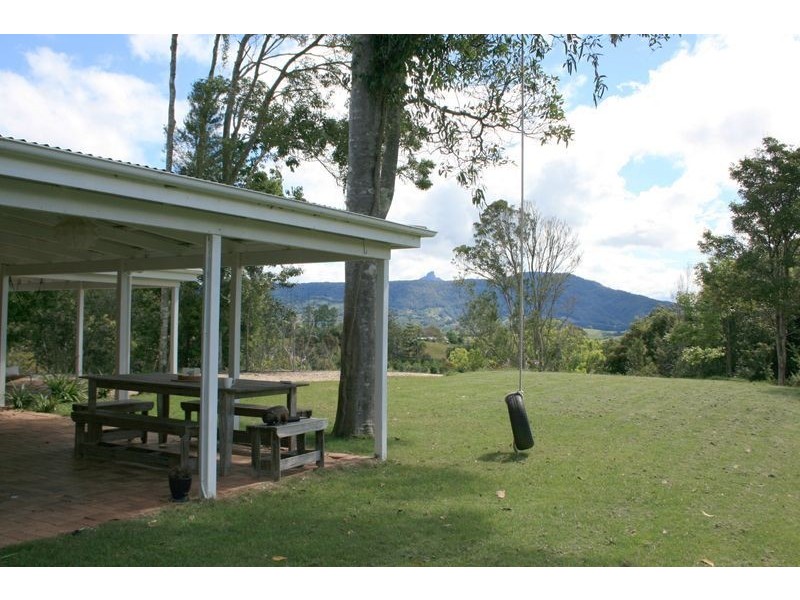
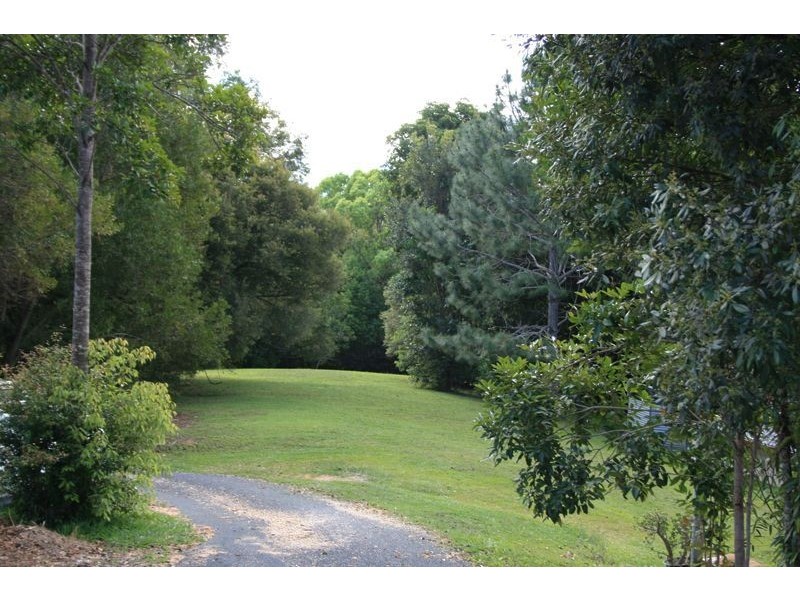
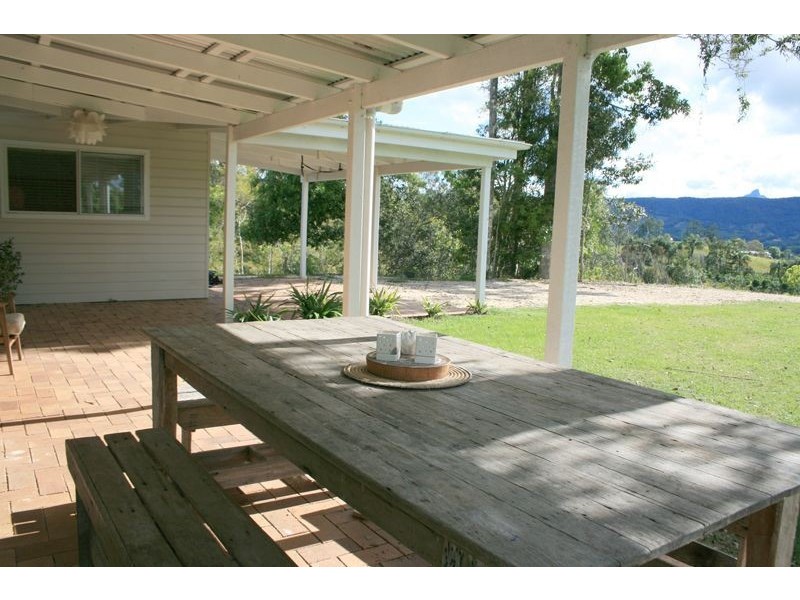
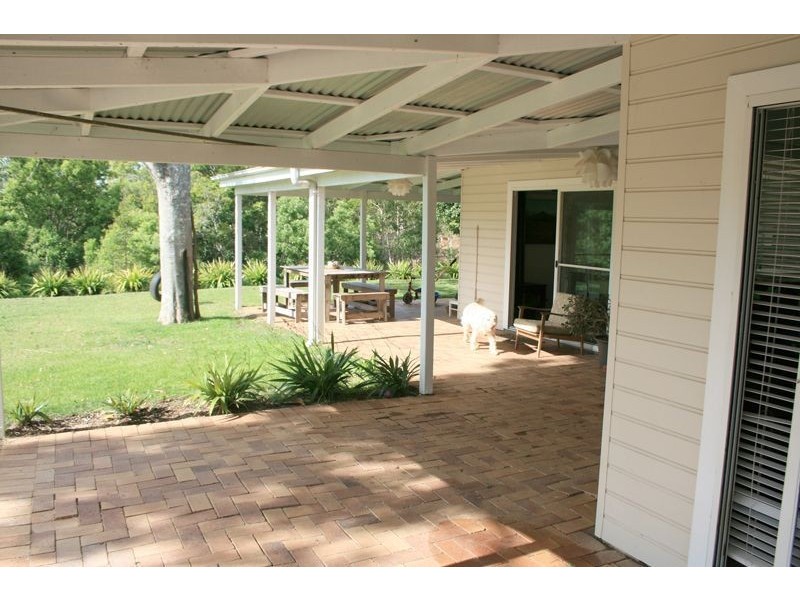
There are approximately 18,049 people living in Murwillumbah but… who are they?
44
49%
51%
Suburb Stats
$834/WK
$250/WK
$382/WK
Value of property in Murwillumbah and nearby suburbs
Murwillumbah
Boat Harbour
Meerschaum Vale
Bangalow
Average Home Price$479,070Average Rental Price$346Household Size2.5
Average Home Price$687,806Average Rental Price$536Household Size2.6
Average Home Price$623,593Average Rental Price$375Household Size2.4
Average Home Price$906,546Average Rental Price$601Household Size2.6
Water Useper year per person
0.6mln. litres
State Average 0.74 mln. litres
Nat. Average 0.74 mln. litres
Greenhouse Pollutionper year per person
16.48tonnes
State Average 19.31 tonnes
Nat. Average 20.3 tonnes
Dwelling Types
91%
5%
3%
Most Common Suburb Professions
17% Professio…
15% Technicia…
14% Managers…
12% Labourers…
Nearby schools: murwillumbah community college, murwillumbah east primary school, murwillumbah south infants school, mt st patrick college
Nearby cafes: fish bowl cafe, the modern grocer, the blue frog, auto cafe
Nearby doctors: queen street medical centre, king street medical centre-dr john moran, king street medical centre-dr yabsley robyn, rightfoot podiatry & footwear clinics
Nearby hospitals: murwillumbah district hospital, queen street medical centre, king street medical centre