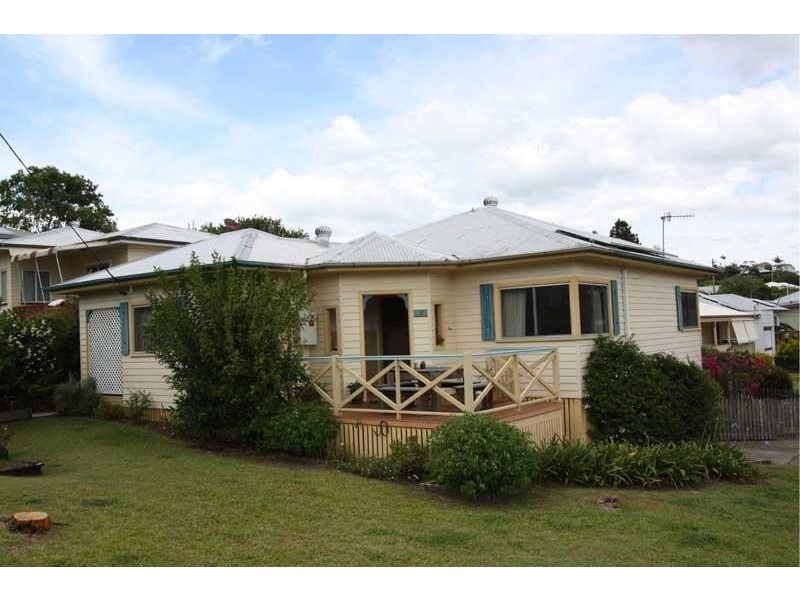
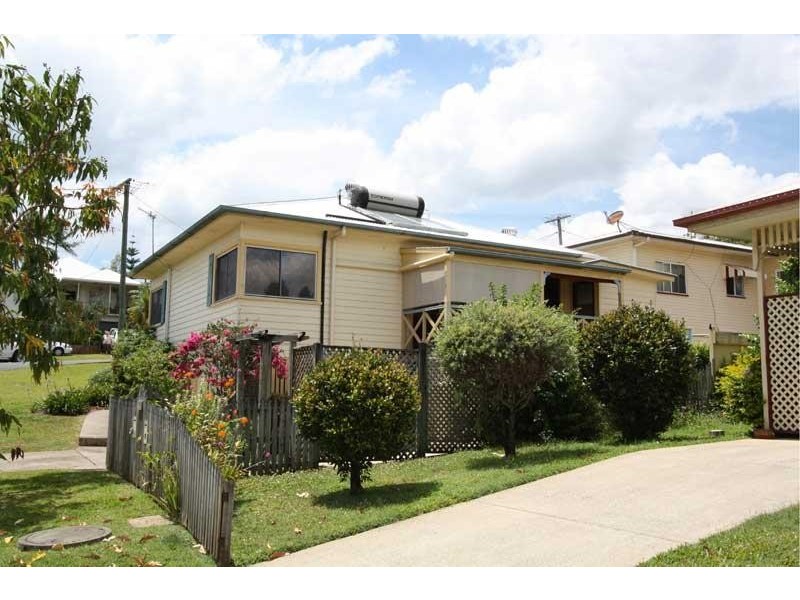
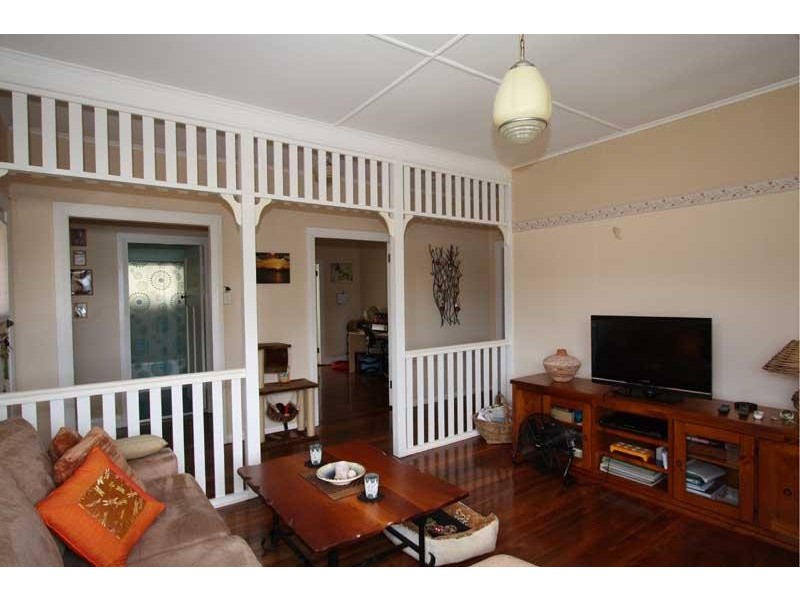
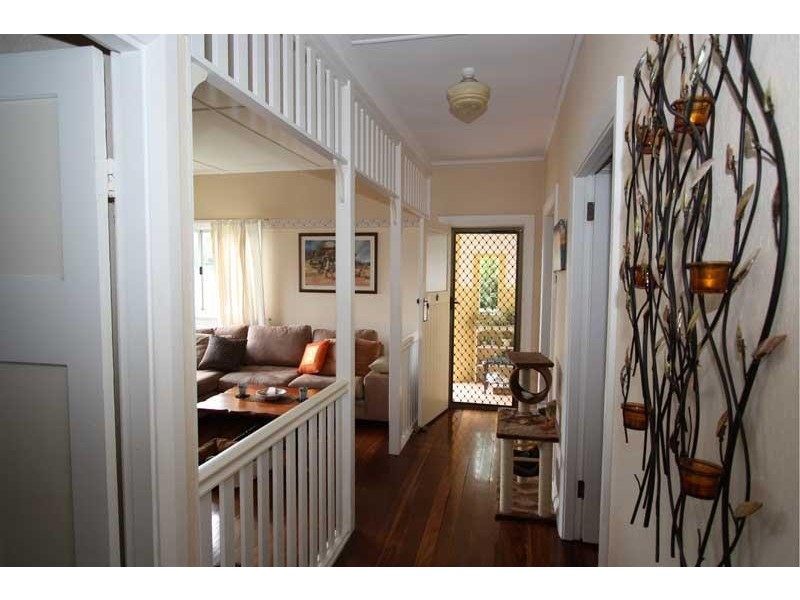
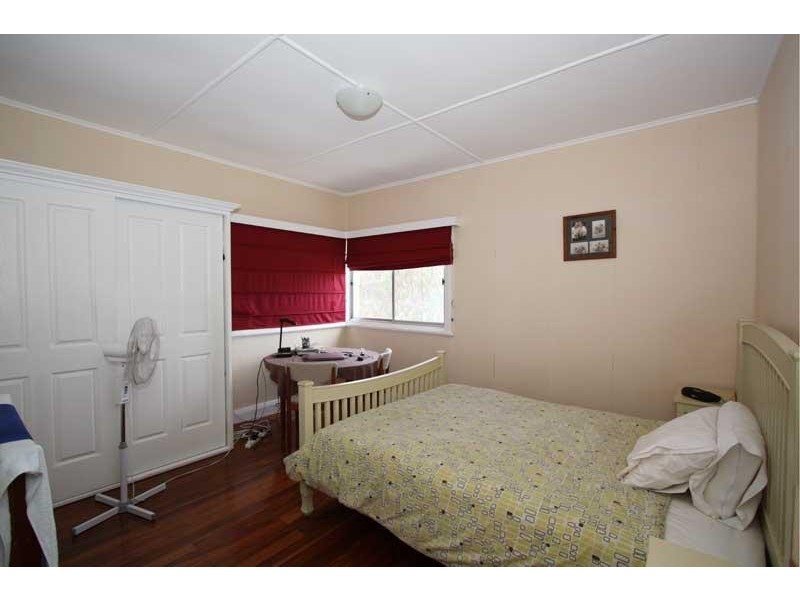
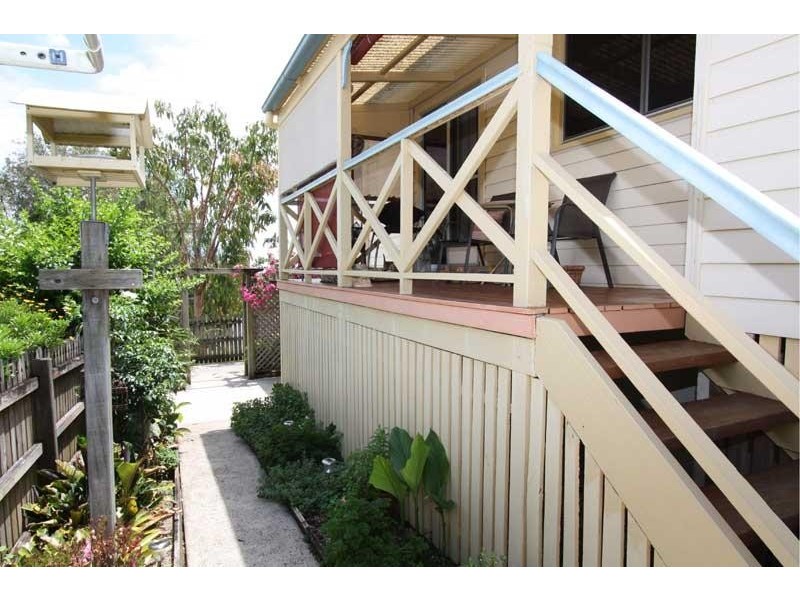
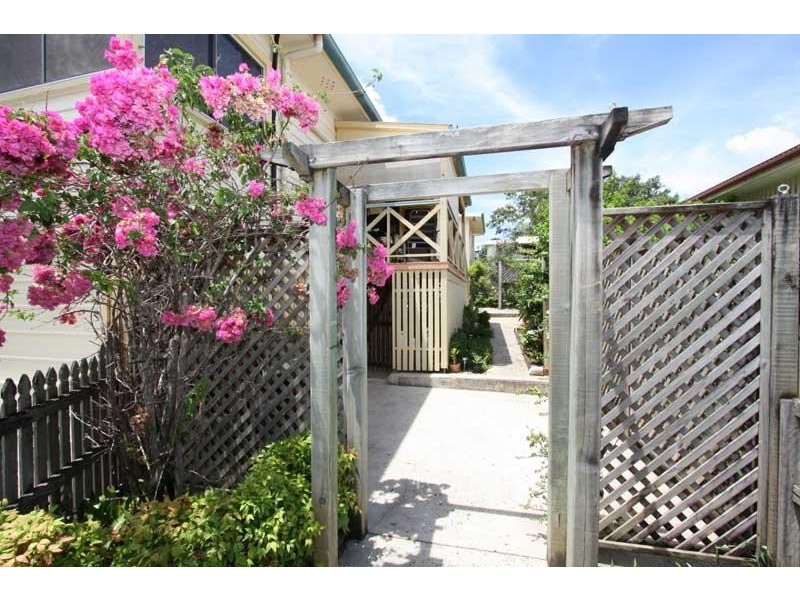
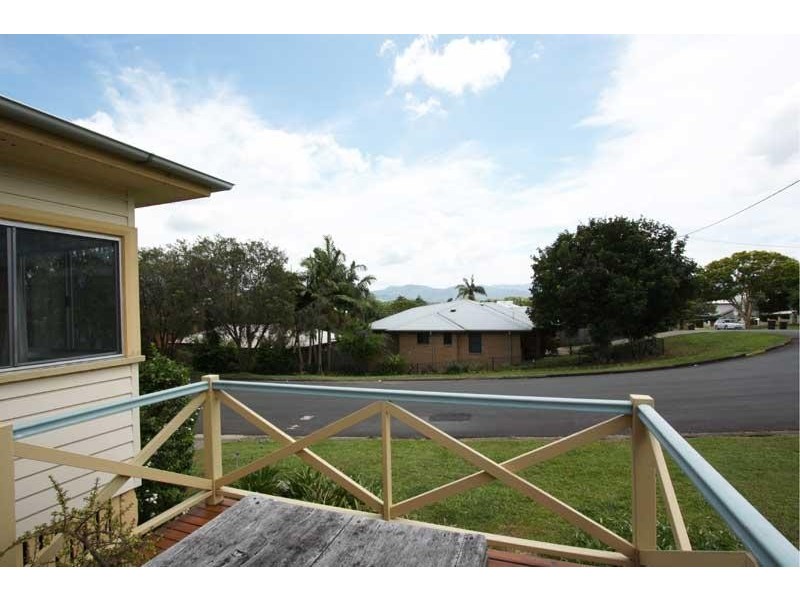
There are approximately 18,049 people living in Murwillumbah but… who are they?
44
49%
51%
Suburb Stats
$834/WK
$250/WK
$382/WK
Value of property in Murwillumbah and nearby suburbs
Murwillumbah
Duranbah
Burringbar
Woombah
Average Home Price$479,070Average Rental Price$346Household Size2.5
Average Home Price$881,000Average Rental Price$515Household Size2.3
Average Home Price$722,921Average Rental Price$383Household Size2.4
Average Home Price$439,199Average Rental Price$357Household Size2.4
Water Useper year per person
0.6mln. litres
State Average 0.74 mln. litres
Nat. Average 0.74 mln. litres
Greenhouse Pollutionper year per person
16.48tonnes
State Average 19.31 tonnes
Nat. Average 20.3 tonnes
Dwelling Types
91%
5%
3%
Most Common Suburb Professions
17% Professio…
15% Technicia…
14% Managers…
12% Labourers…
Nearby schools: murwillumbah community college, murwillumbah high school, murwillumbah south infants school, murwillumbah east primary school
Nearby cafes: cenzo cafe, fish bowl cafe, auto cafe, the modern grocer
Nearby doctors: king street medical centre-jenkins helen, king street dental practice - dr. evans michael, kettle i h, king street medical centre-dr john moran
Nearby hospitals: queen street medical centre, murwillumbah district hospital, king street medical centre