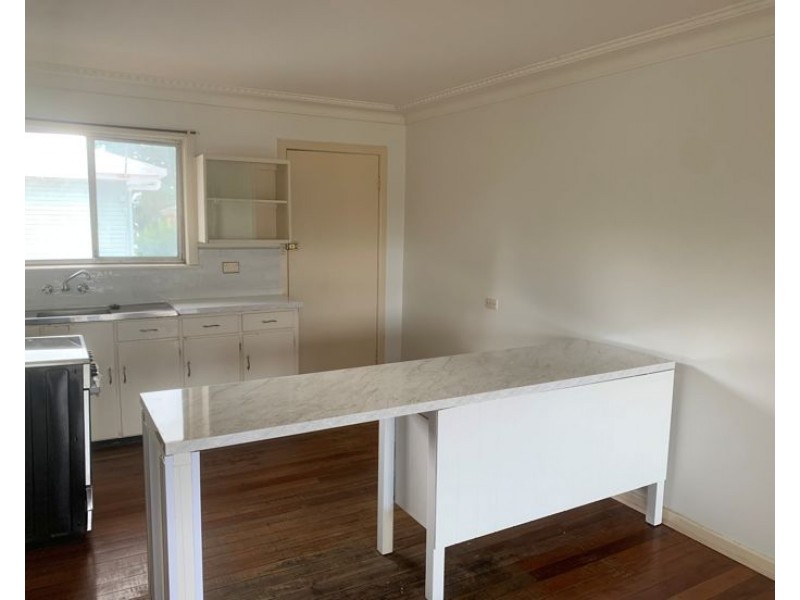
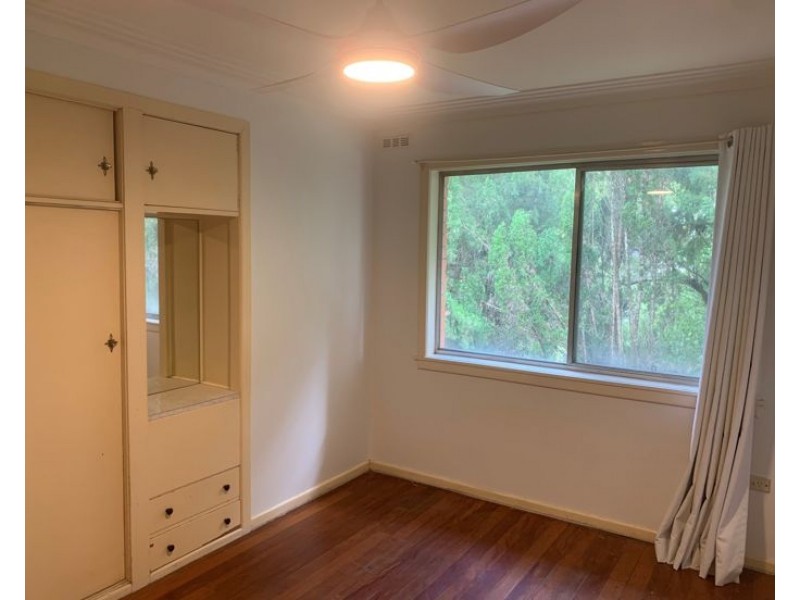
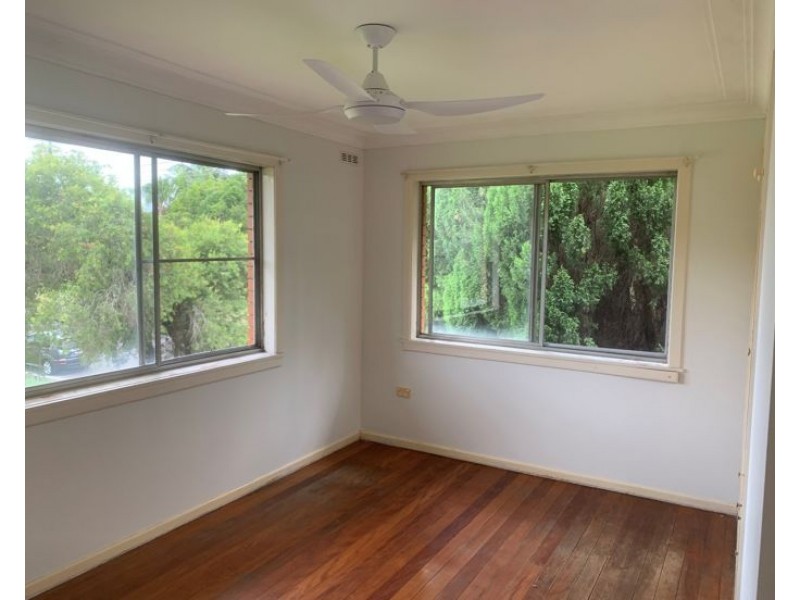
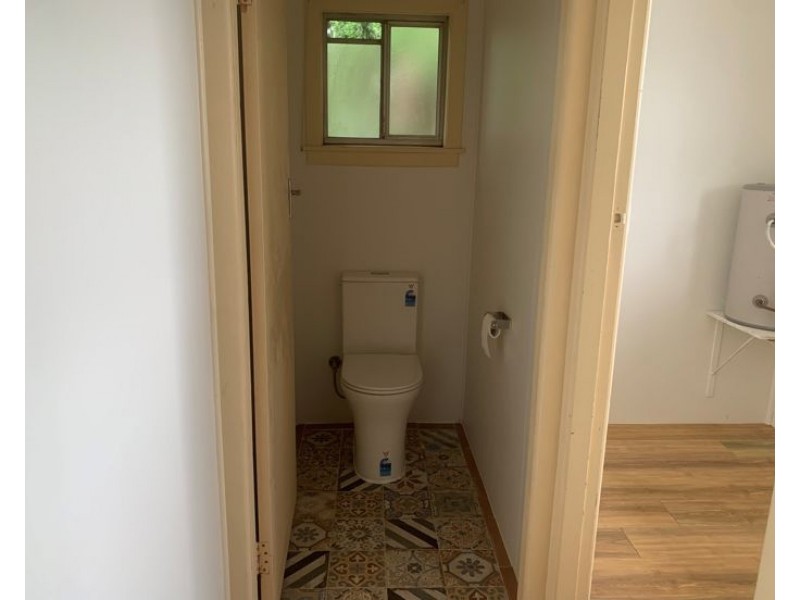
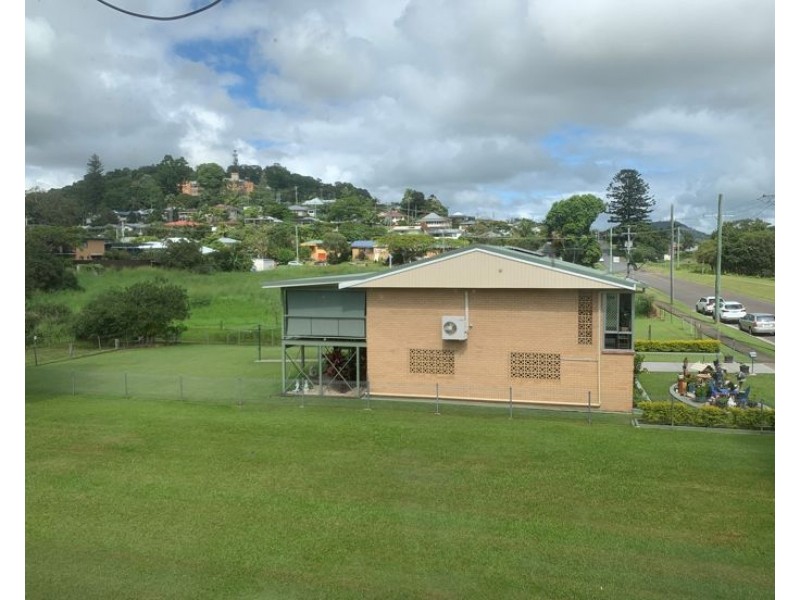
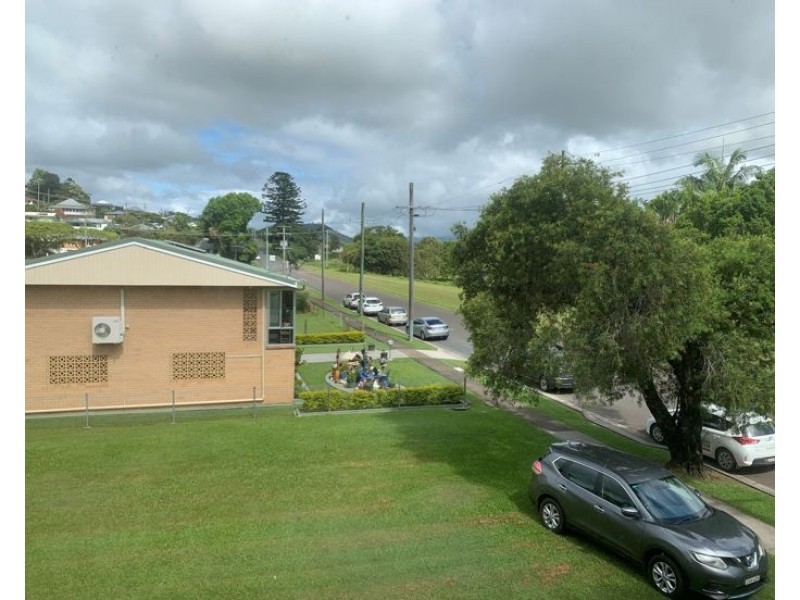
There are approximately 18,049 people living in Murwillumbah but… who are they?
44
49%
51%
Suburb Stats
$834/WK
$250/WK
$382/WK
Value of property in Murwillumbah and nearby suburbs
Murwillumbah
Brushgrove
Bangalow
Nimbin
Average Home Price$479,070Average Rental Price$346Household Size2.5
Average Home Price$460,239Average Rental Price$327Household Size2.4
Average Home Price$906,546Average Rental Price$601Household Size2.6
Average Home Price$463,353Average Rental Price$314Household Size2.4
Water Useper year per person
0.6mln. litres
State Average 0.74 mln. litres
Nat. Average 0.74 mln. litres
Greenhouse Pollutionper year per person
16.48tonnes
State Average 19.31 tonnes
Nat. Average 20.3 tonnes
Dwelling Types
91%
5%
3%
Most Common Suburb Professions
17% Professio…
15% Technicia…
14% Managers…
12% Labourers…
Nearby schools: murwillumbah south infants school, murwillumbah high school, murwillumbah community college, mt st patrick college
Nearby cafes: the modern grocer, fish bowl cafe, dabelles cafe, king street cafe
Nearby doctors: king street medical centre-dr john moran, snedden d a, king street medical centre-warne douglas, advanced radiology clinics murwillumbah
Nearby hospitals: king street medical centre, murwillumbah district hospital, queen street medical centre