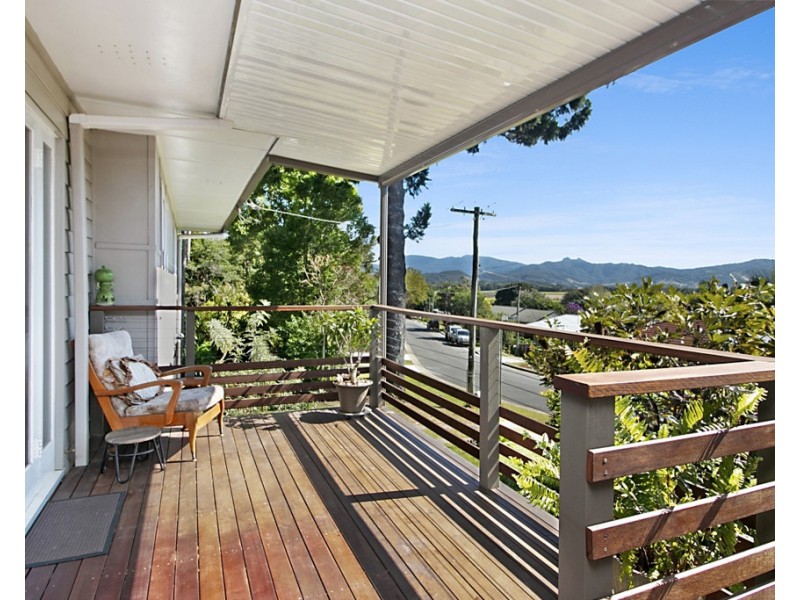
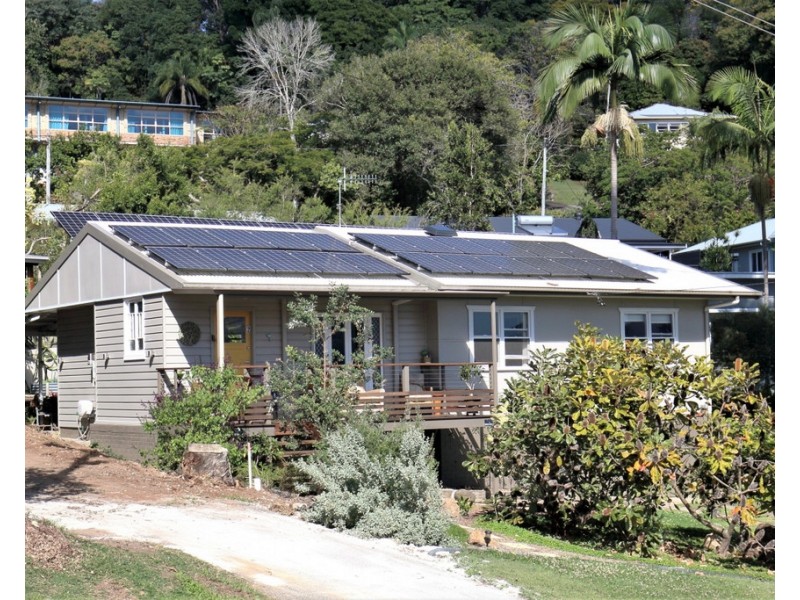
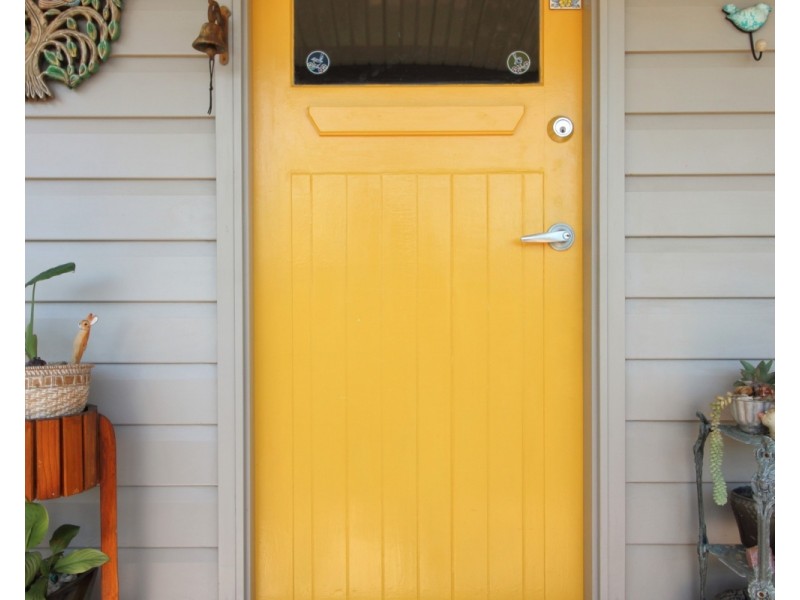
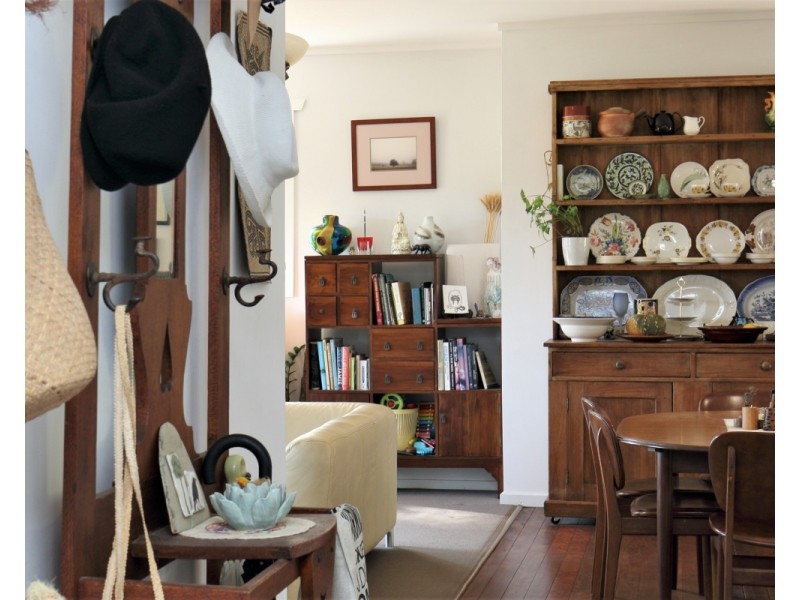
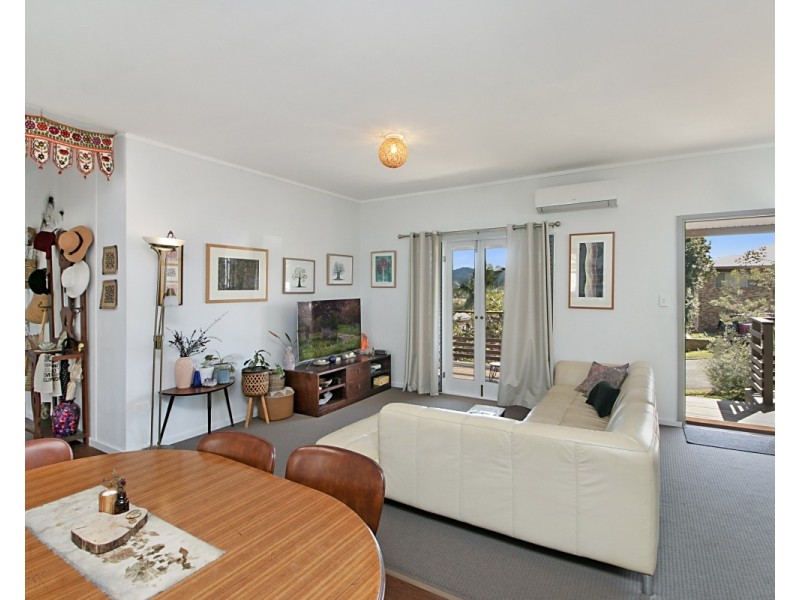
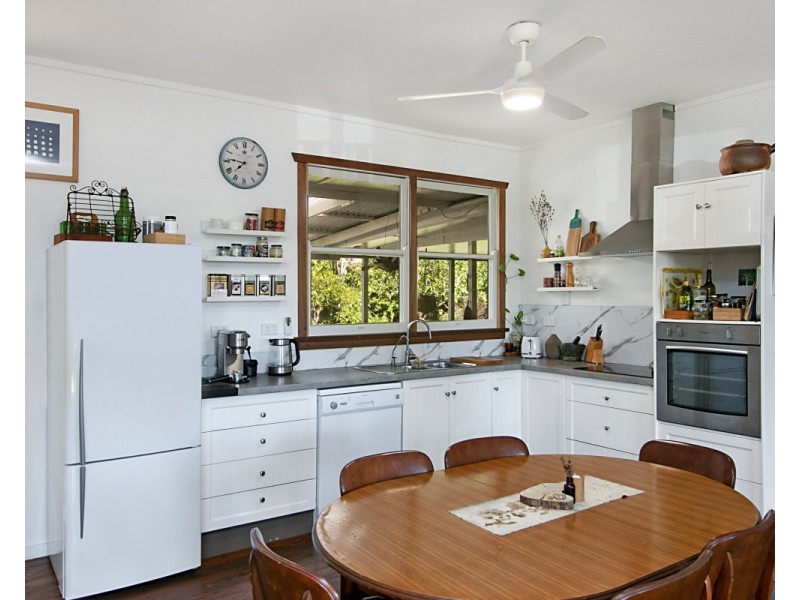
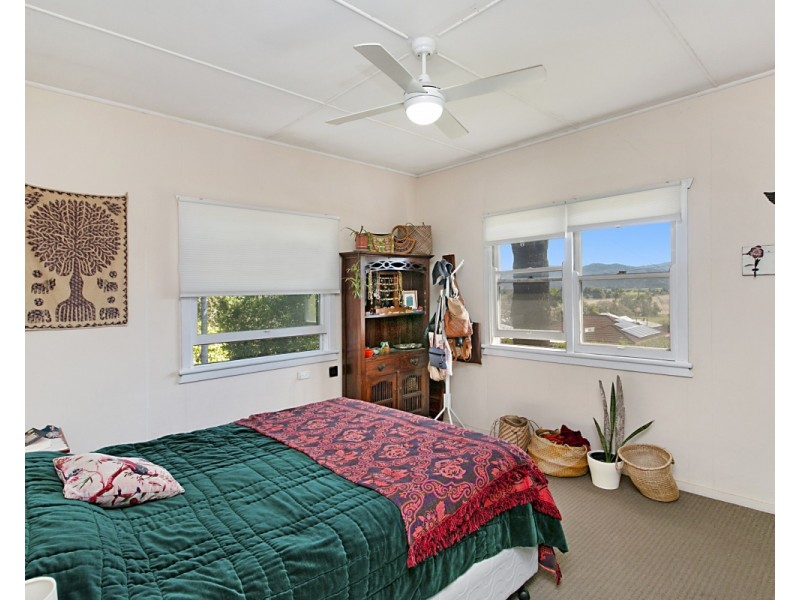
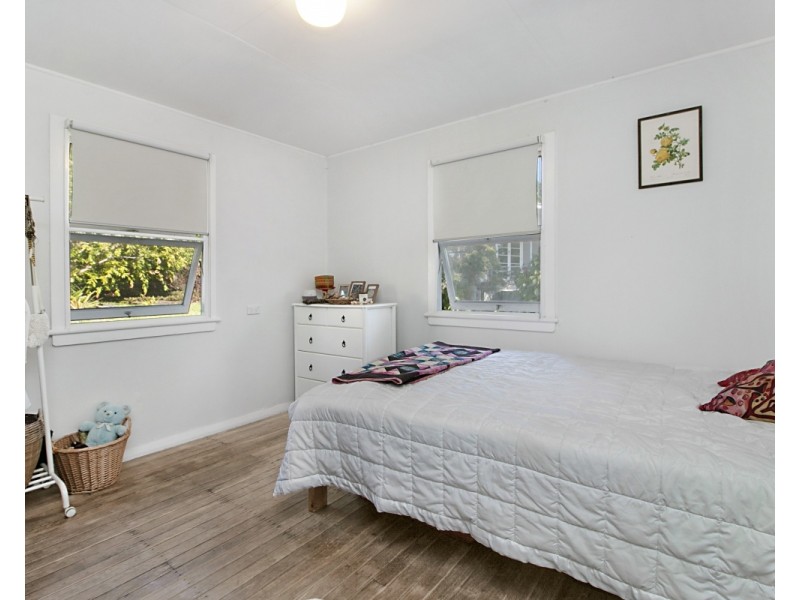
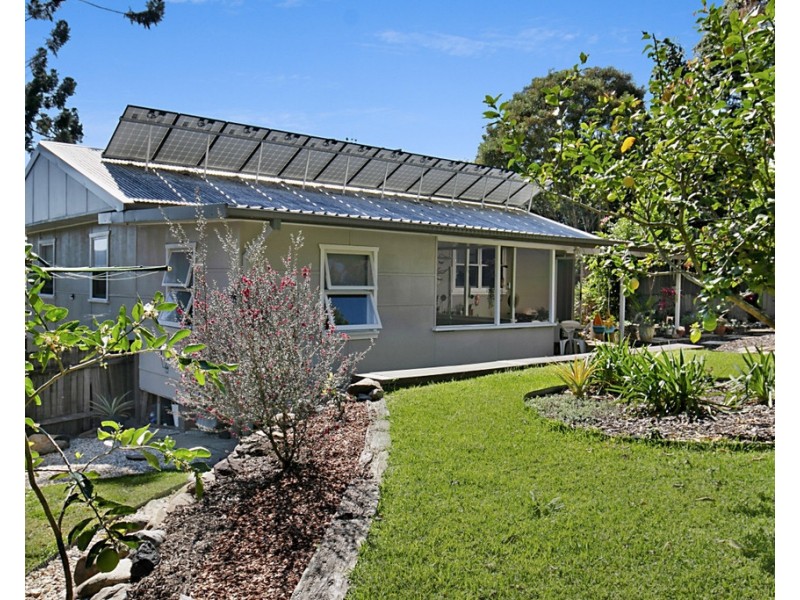
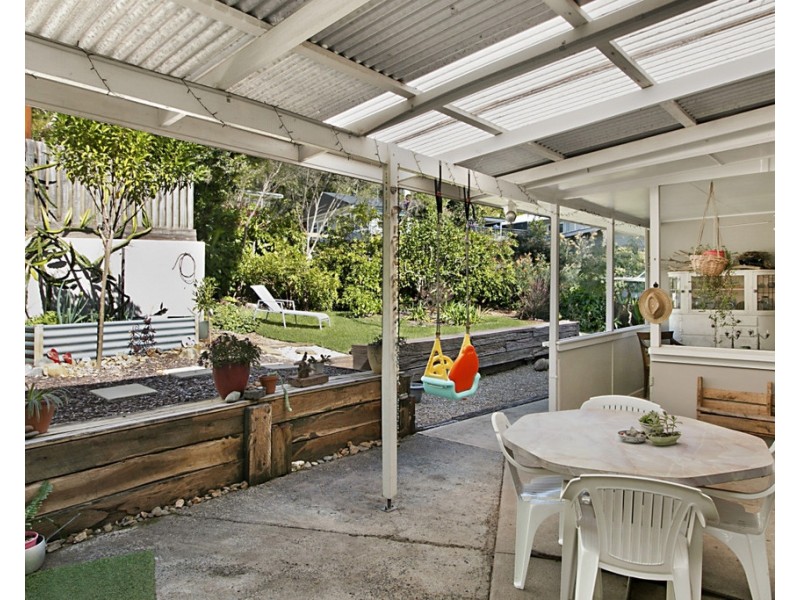
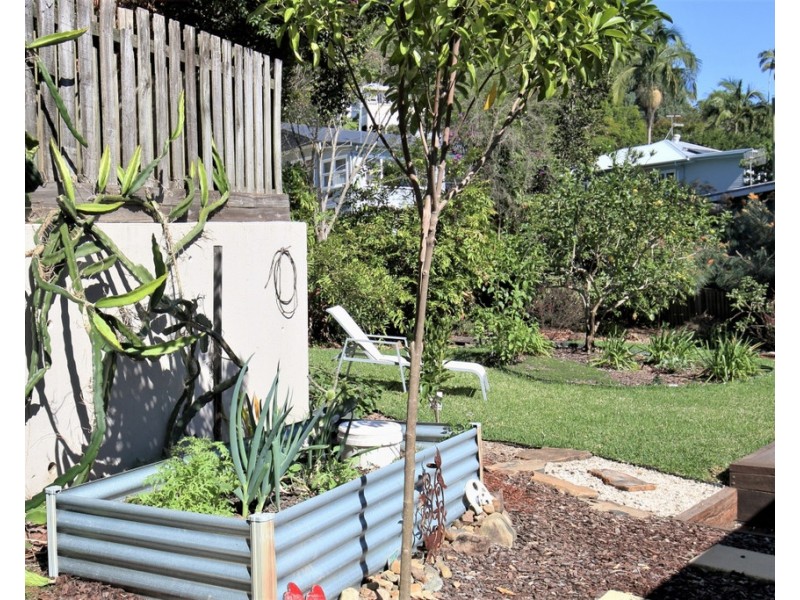
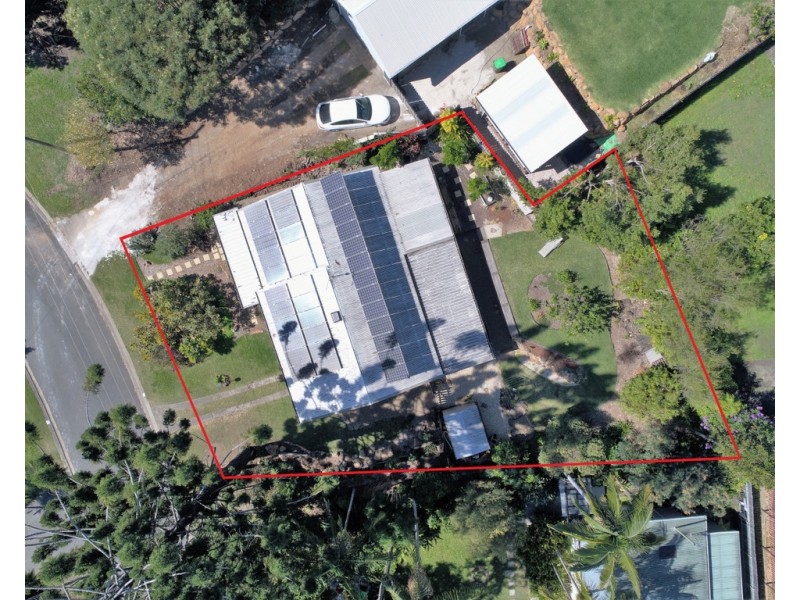
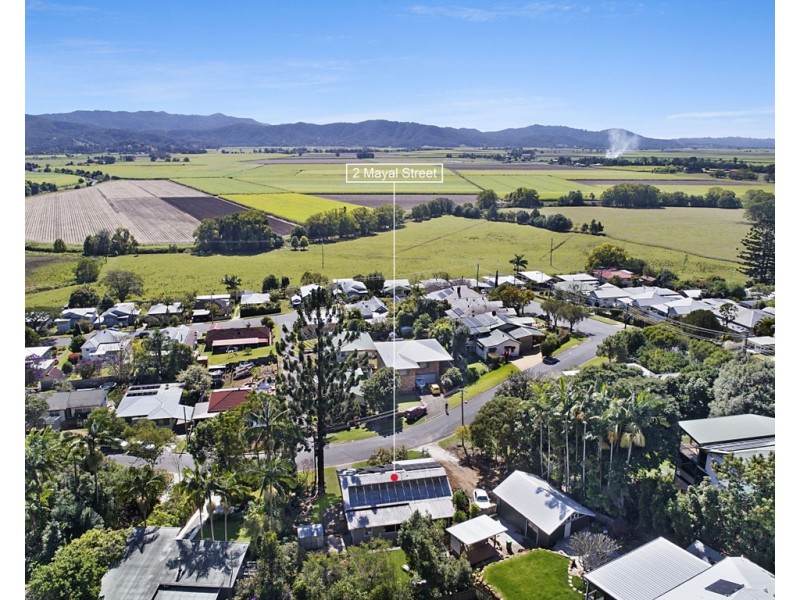
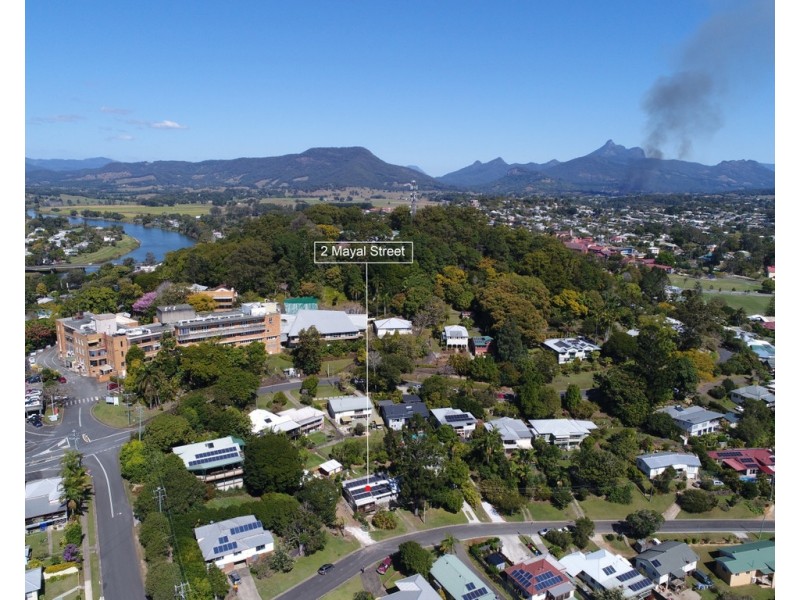
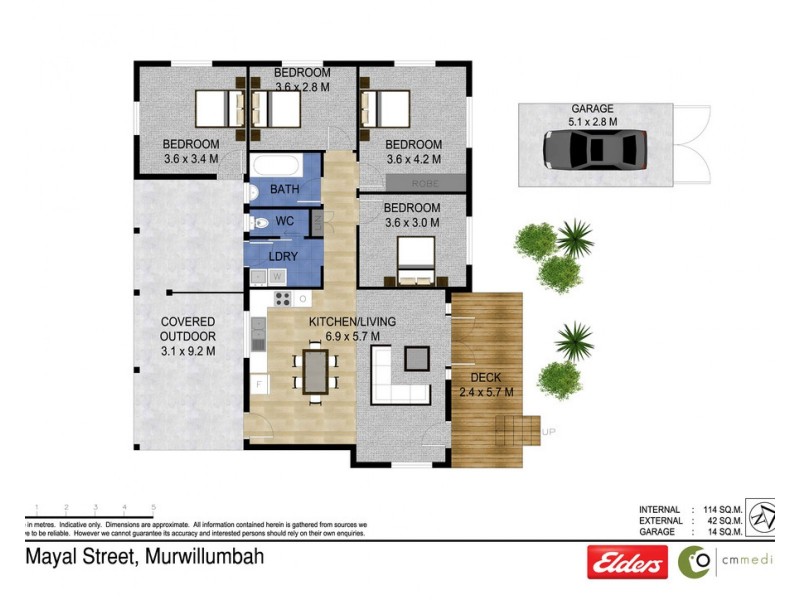
2 MAYAL STREET, Murwillumbah NSW 2484 Cottage on Hospital Hill $800,000 - $840,000 4 1 1 Listing ID: 40468023 Other properties for sale near 2 MAYAL STREET, Murwillumbah NSW 2484 37 EWING STREET, Murwillumbah NSW 2484 37 EWING STREET, Murwillumbah NSW 2484 Location THIS PROPERTY WAS SOLD Enquiry about this property Name* Email* Phone* Message* Send me regular newsletters from Homehound Have agents get in touch about similar properties within the area What is 8 + 20?* Receive email alerts for properties like this Email alerts Email* Send me regular newsletters from Homehound. Have agents get in touch about similar properties within the area What is 8 + 20?*