There are approximately 18,049 people living in Murwillumbah but… who are they?
44
49%
51%
Suburb Stats
$834/WK
$250/WK
$382/WK
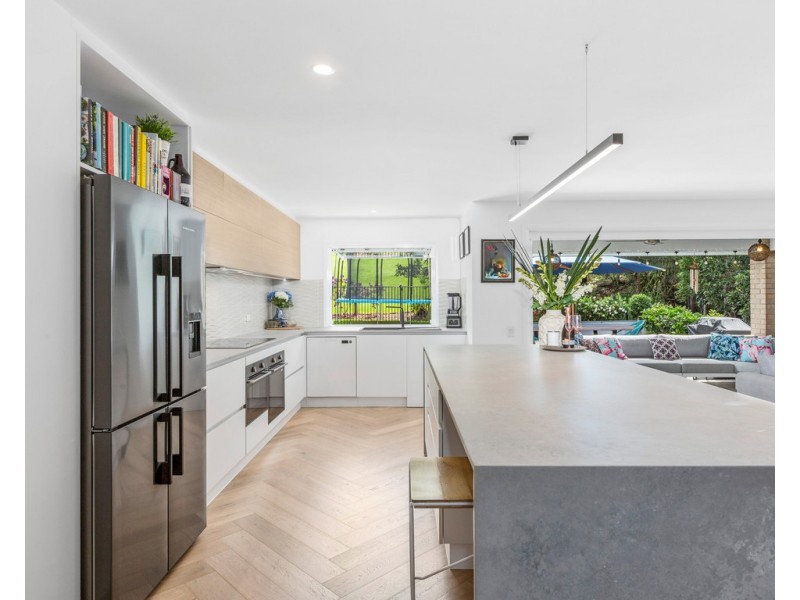
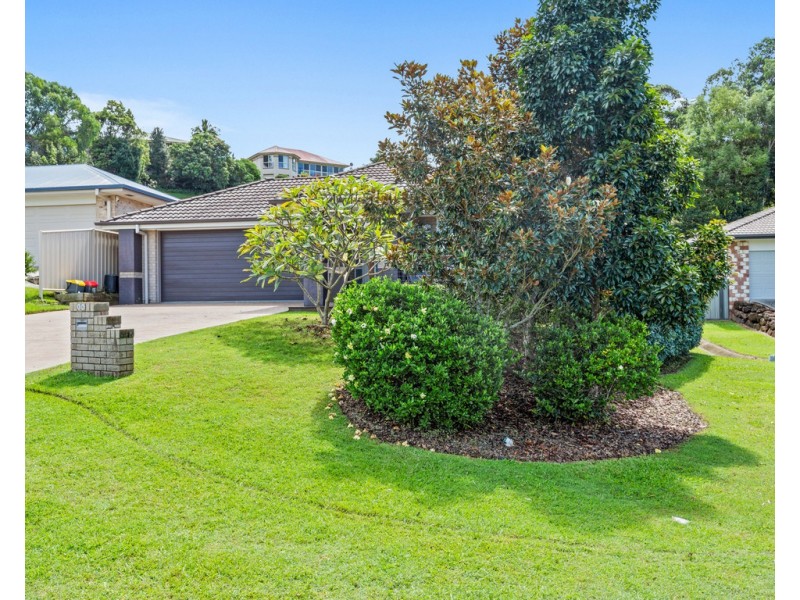
Value of property in Murwillumbah and nearby suburbs
Murwillumbah
Safety Beach
McKees Hill
Bangalow
Average Home Price$479,070Average Rental Price$346Household Size2.5
Average Home Price$575,379Average Rental Price$454Household Size2.5
Average Home Price$551,222Average Rental Price$309Household Size2.4
Average Home Price$906,546Average Rental Price$601Household Size2.6
Water Useper year per person
0.6mln. litres
State Average 0.74 mln. litres
Nat. Average 0.74 mln. litres
Greenhouse Pollutionper year per person
16.48tonnes
State Average 19.31 tonnes
Nat. Average 20.3 tonnes
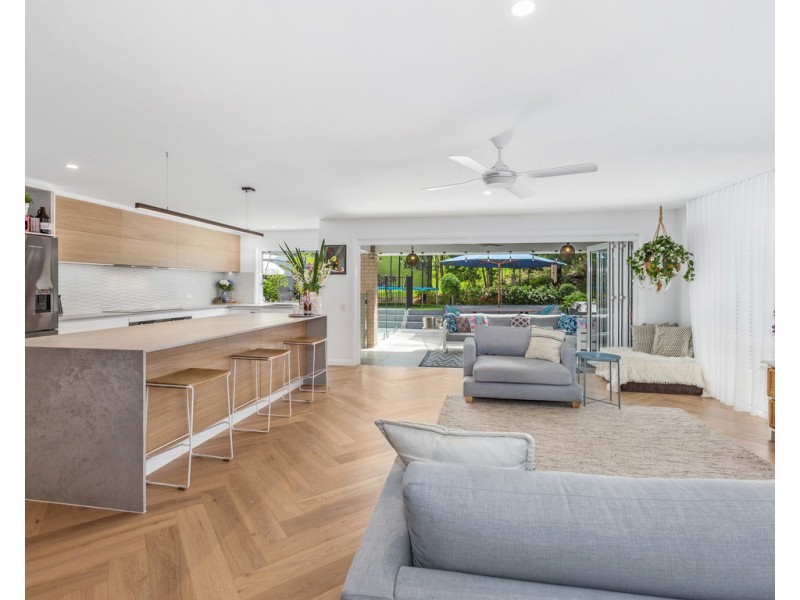
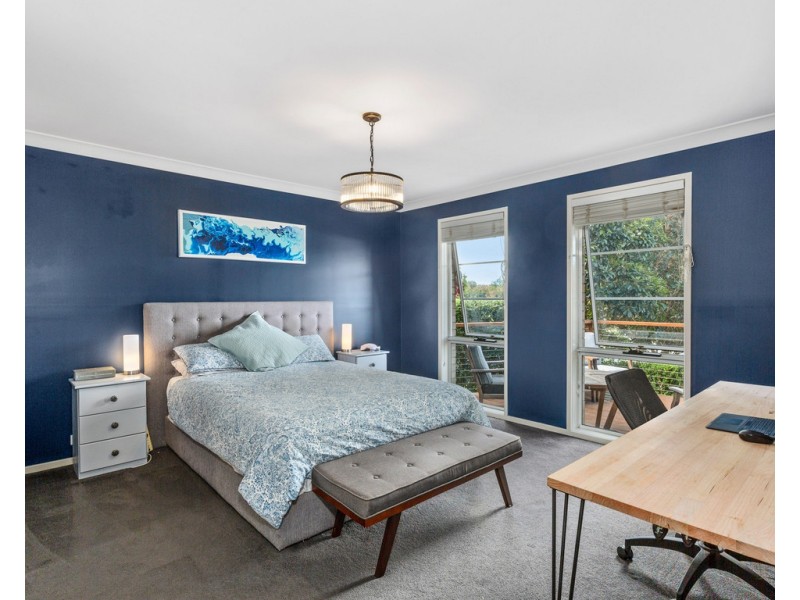
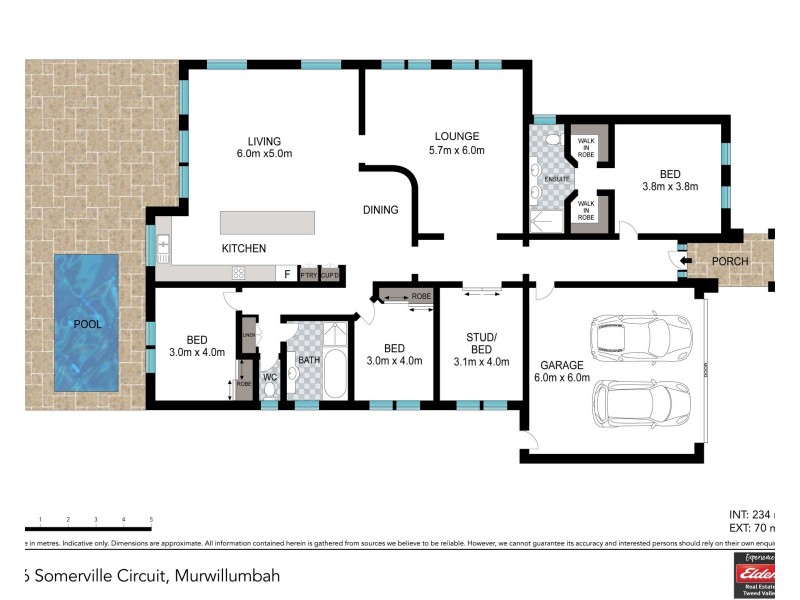
Dwelling Types
91%
5%
3%
Most Common Suburb Professions
17% Professio…
15% Technicia…
14% Managers…
12% Labourers…
Nearby schools: murwillumbah high school, murwillumbah south infants school, mt st patrick college, murwillumbah east primary school
Nearby cafes: cenzo cafe, auto cafe, sugar beat cafe, fish bowl cafe
Nearby doctors: king street dental practice, queen street medical centre, rightfoot podiatry & footwear clinics, king street medical centre-dr yabsley robyn
Nearby hospitals: murwillumbah district hospital, king street medical centre, queen street medical centre