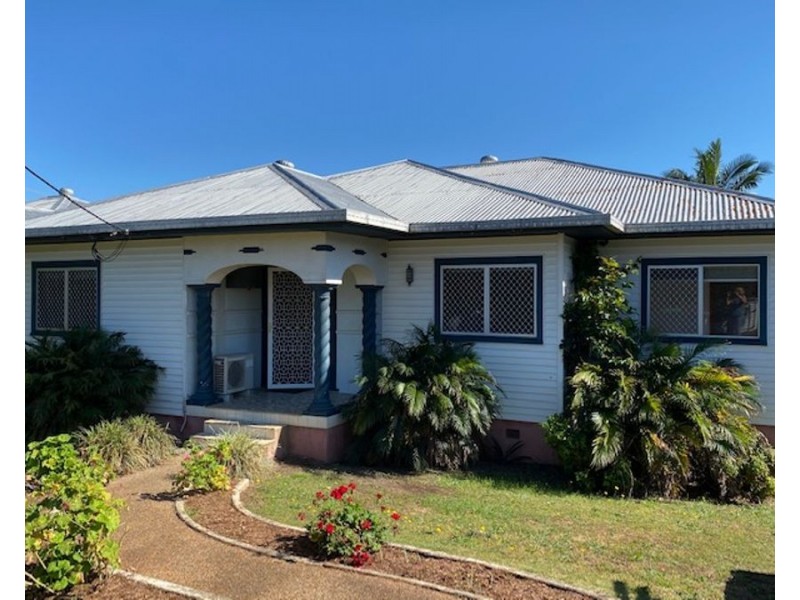
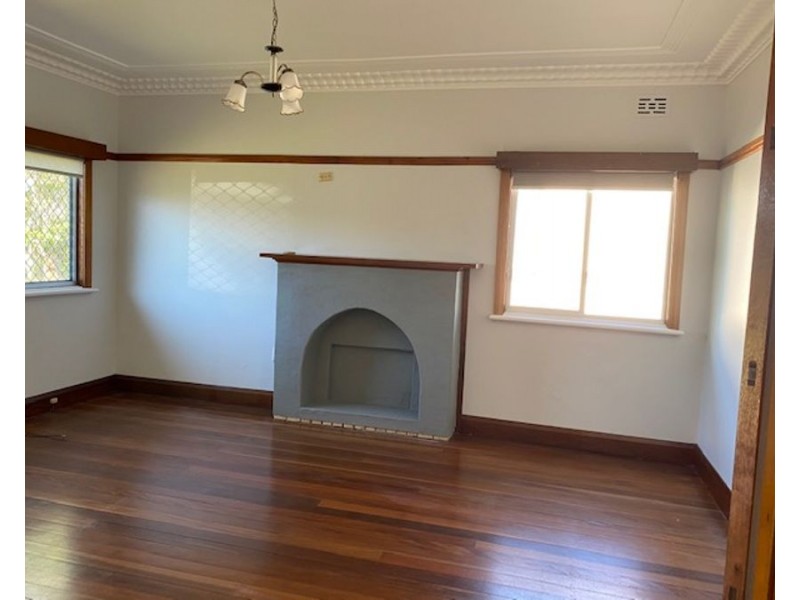
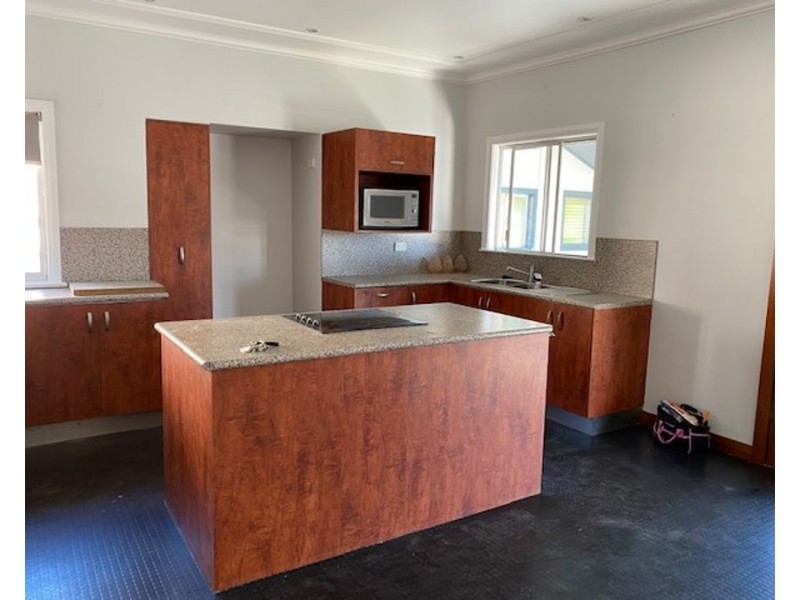
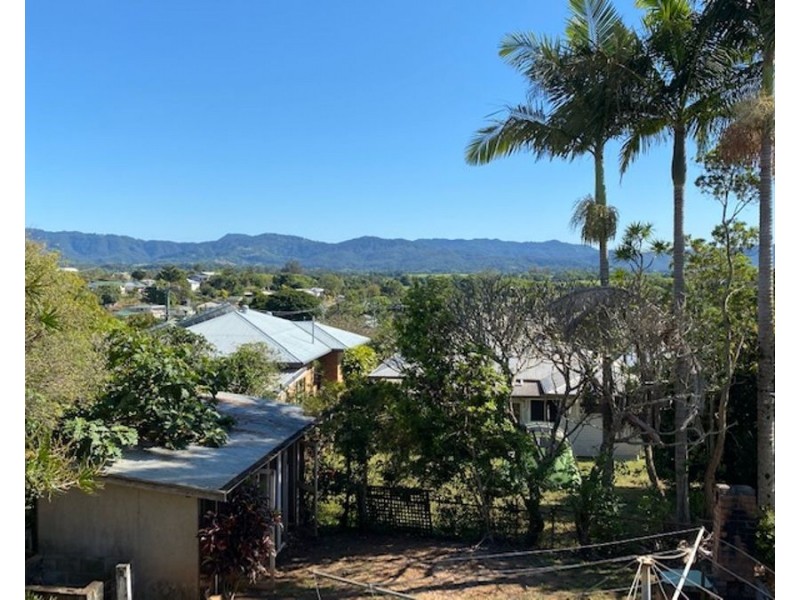
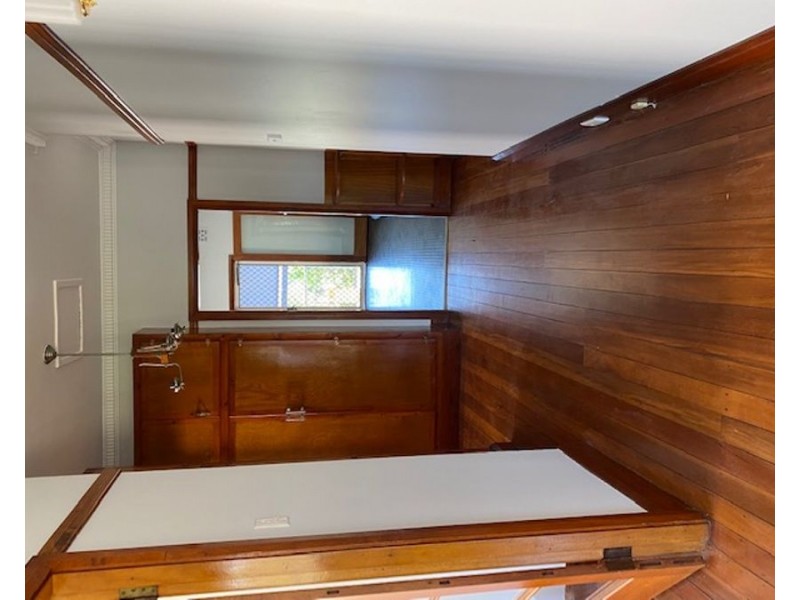
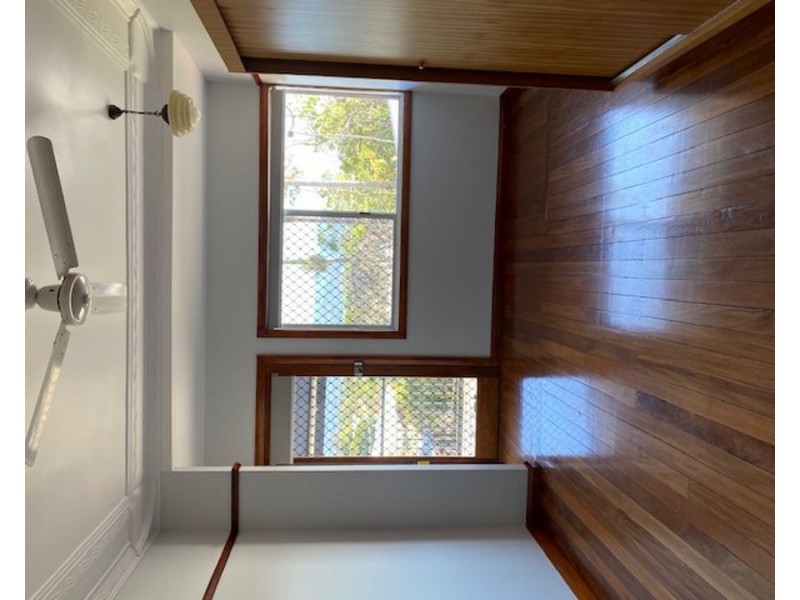
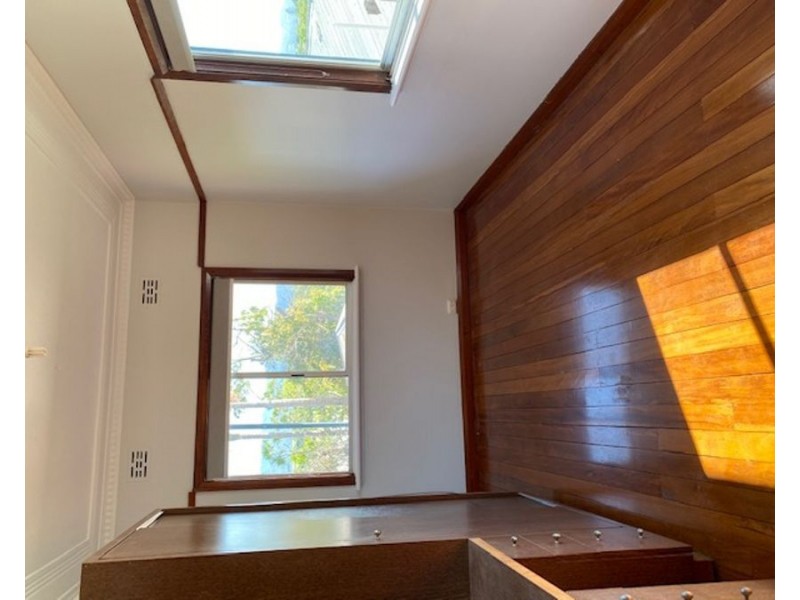
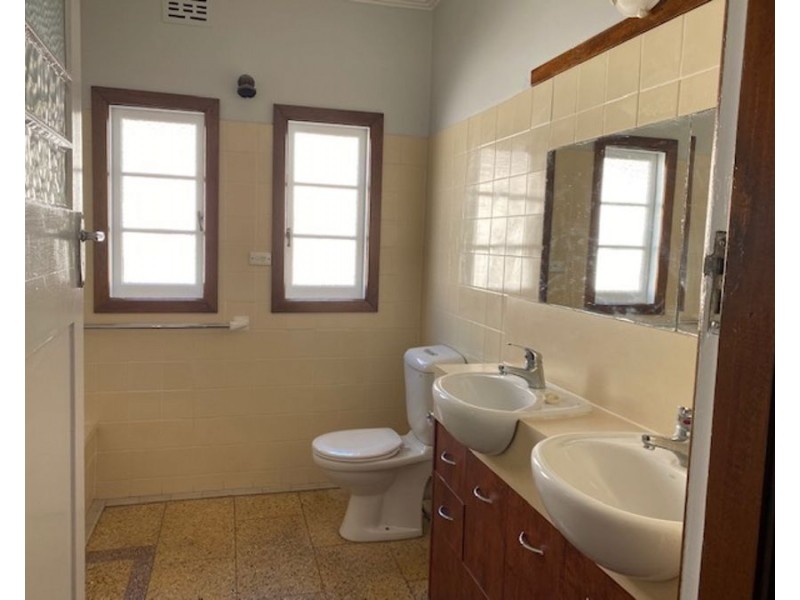
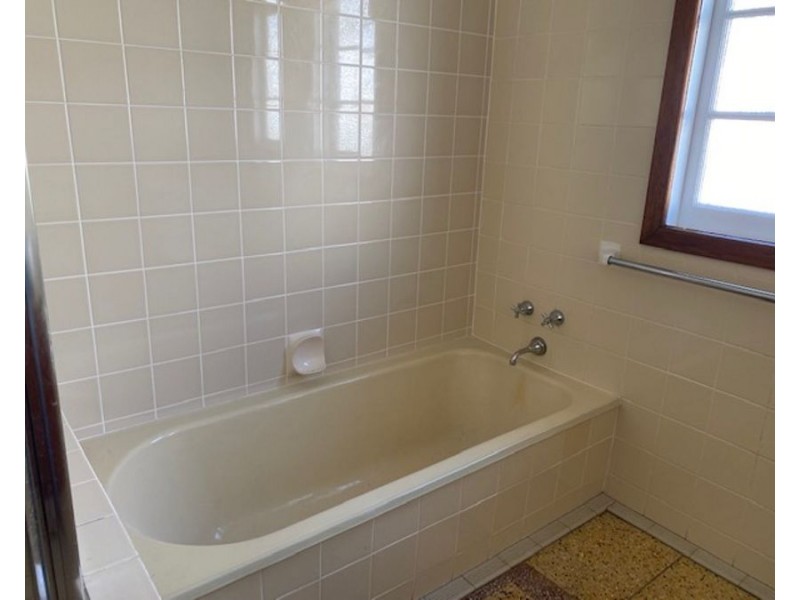
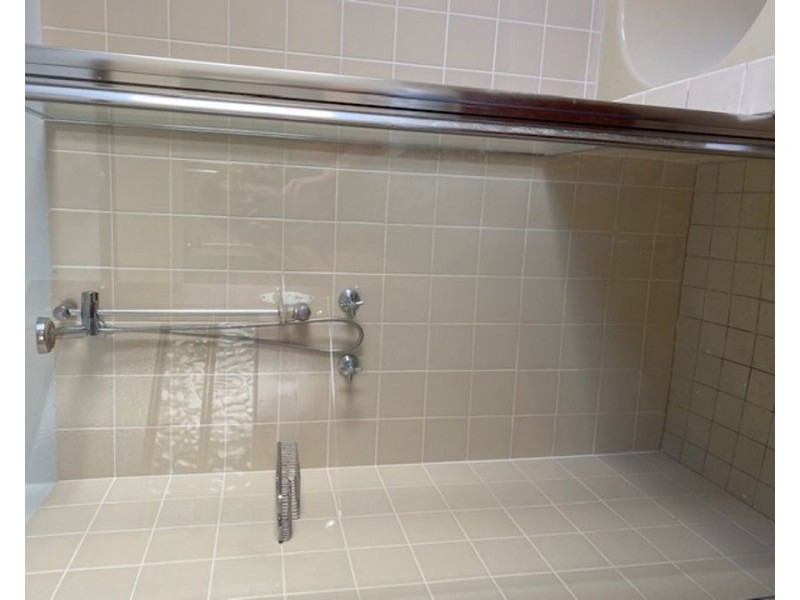
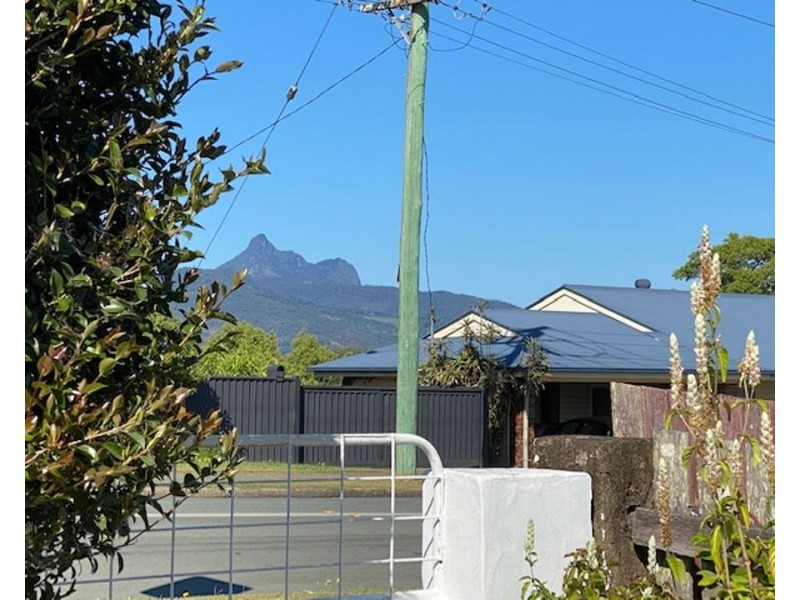
107 Byangum Road, Murwillumbah NSW 2484 Art Deco Style Family Home - UNDER APPLICATION $550 weekly 3 1 1 Enquire Listing ID: 39723583 Other properties to rent near 107 Byangum Road, Murwillumbah NSW 2484 11/198 Byangum Road, Murwillumbah NSW 2484 68 Byangum Road, Murwillumbah NSW 2484 399 Bakers Road Byangum, Murwillumbah NSW 2484 1/191 Byangum Road, Murwillumbah NSW 2484 Location Enquire Enquiry about this property Name* Email* Phone* Message* Send me regular newsletters from Homehound Have agents get in touch about similar properties within the area What is 8 + 20?* Receive email alerts for properties like this Email alerts Email* Send me regular newsletters from Homehound. Have agents get in touch about similar properties within the area What is 8 + 20?*