Listing ID: 37244228
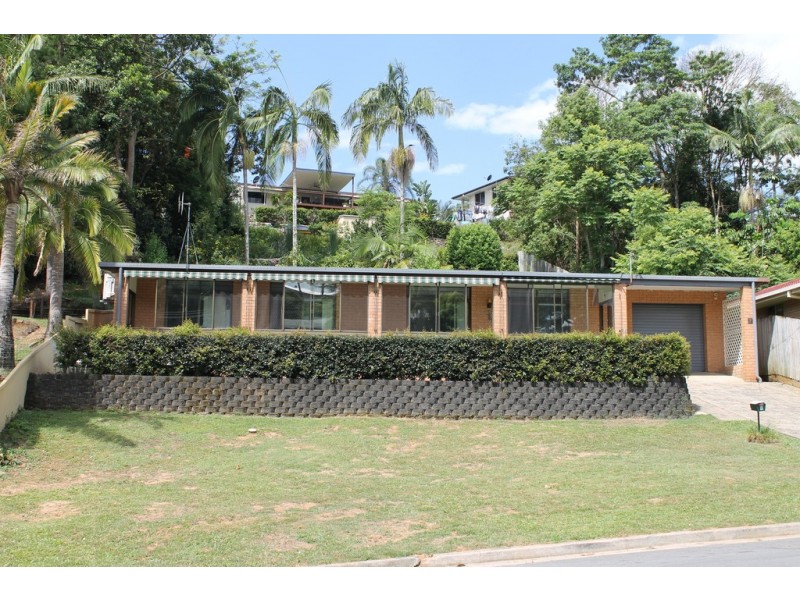
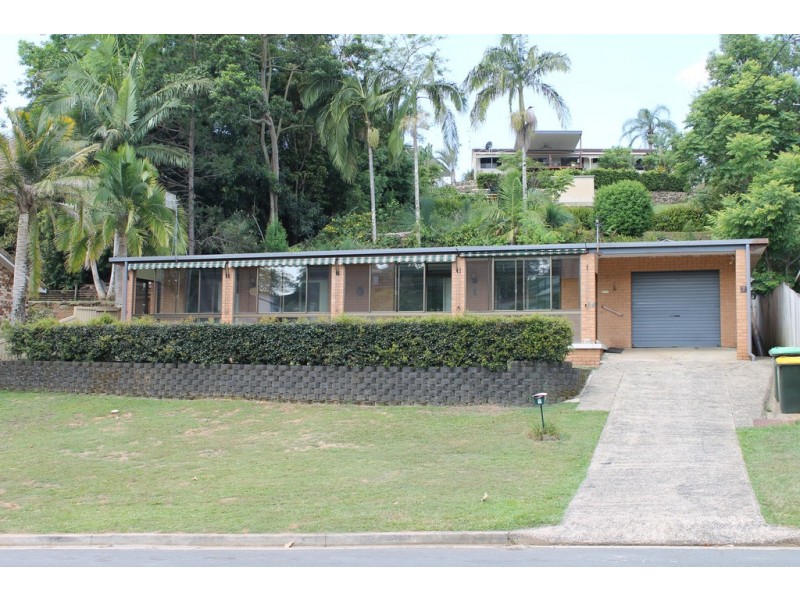
7 JOSHUA STREET, Murwillumbah NSW 2484
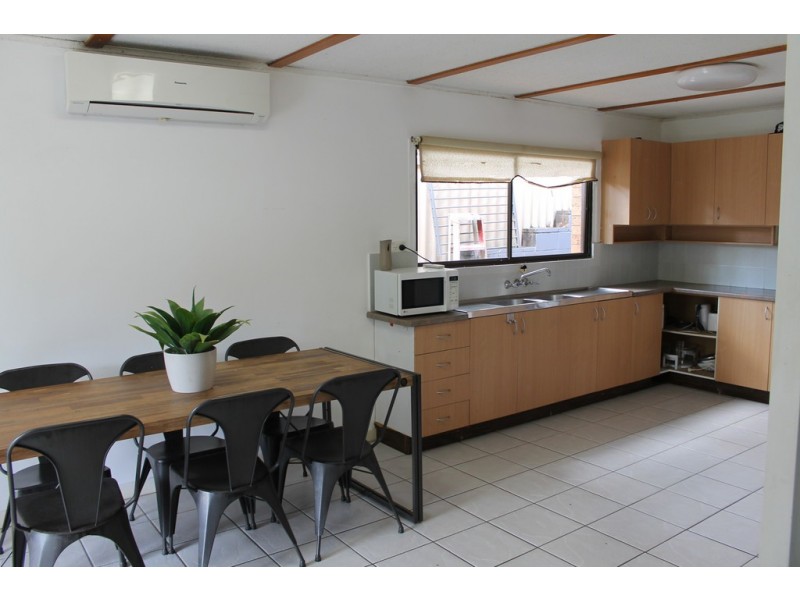
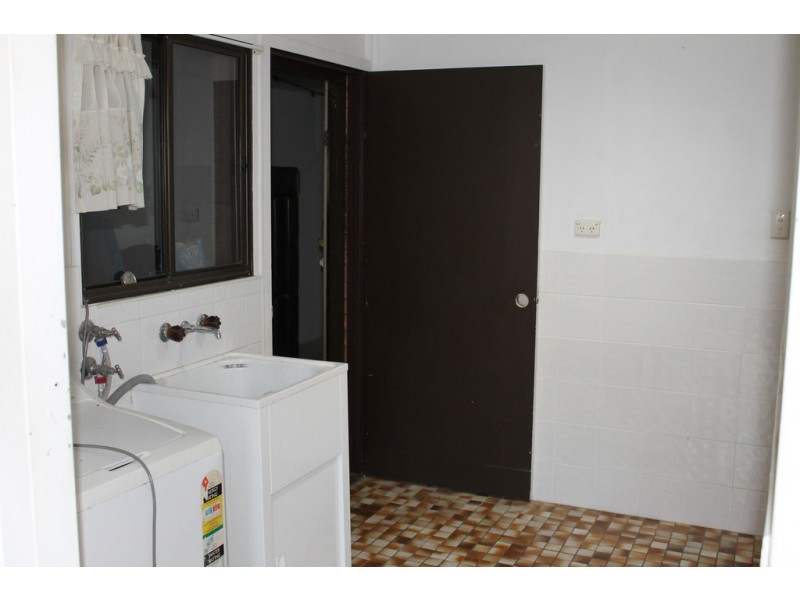
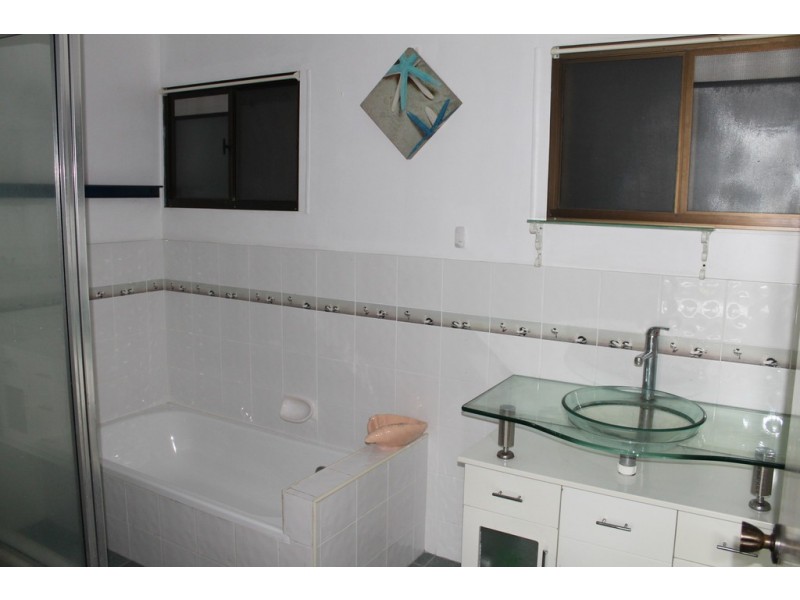
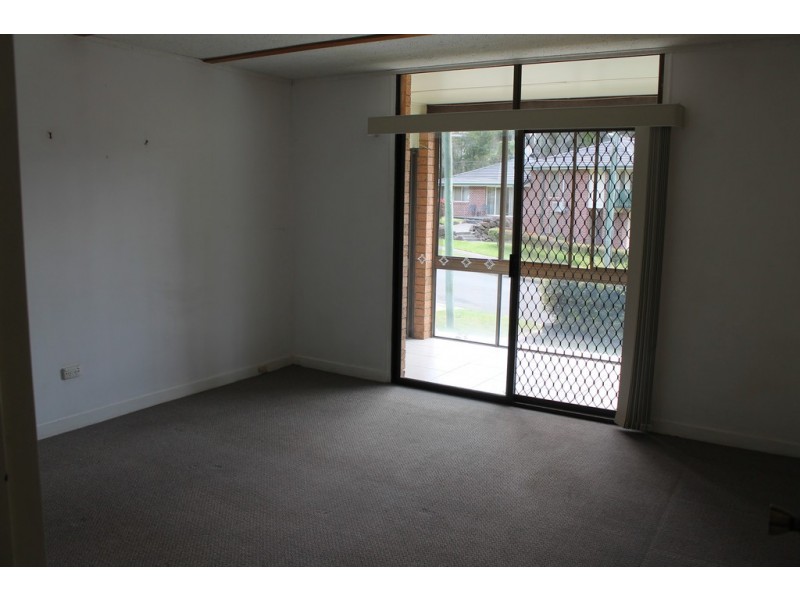
A Perfect Starter or Investment
$420,000
- Listing history:
- 27 Nov, 2014
- 15 Nov, 2018
- 19 Dec, 2022

- 3
- 1
- 2
A Perfect Starter or Investment


Listing ID: 37244228