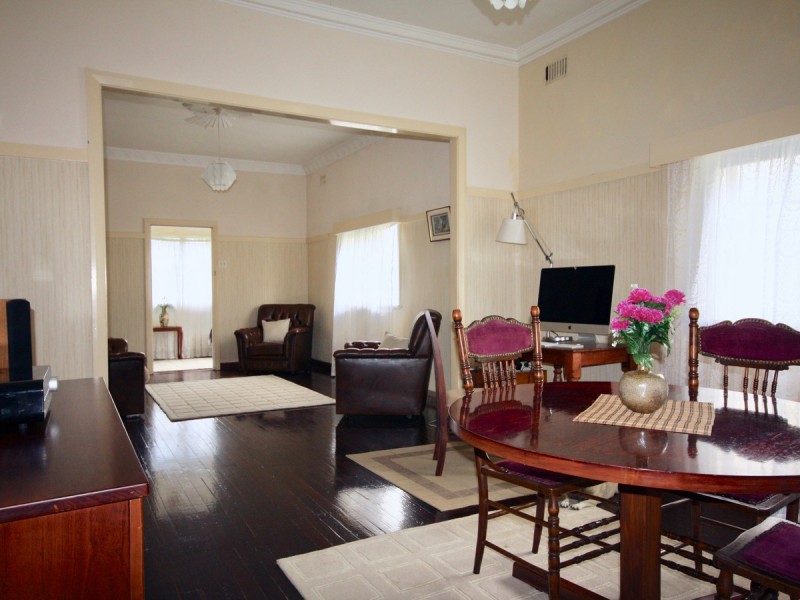
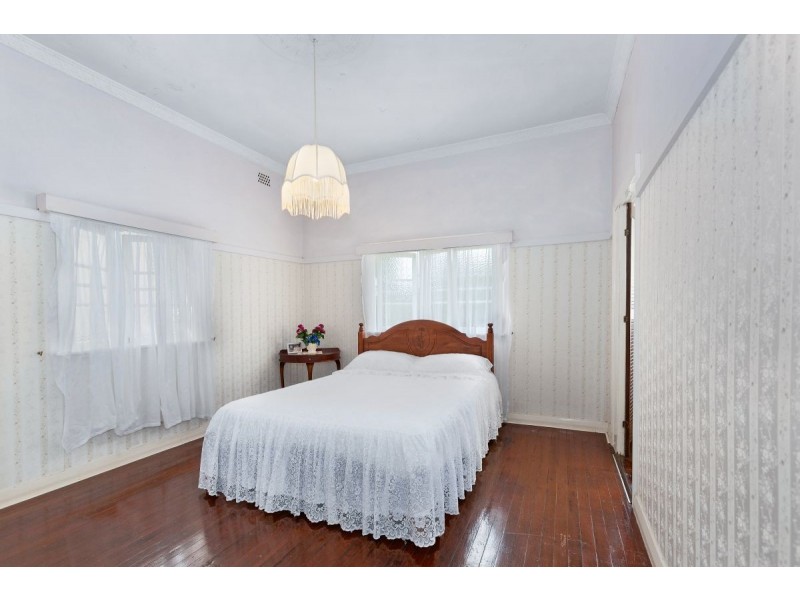
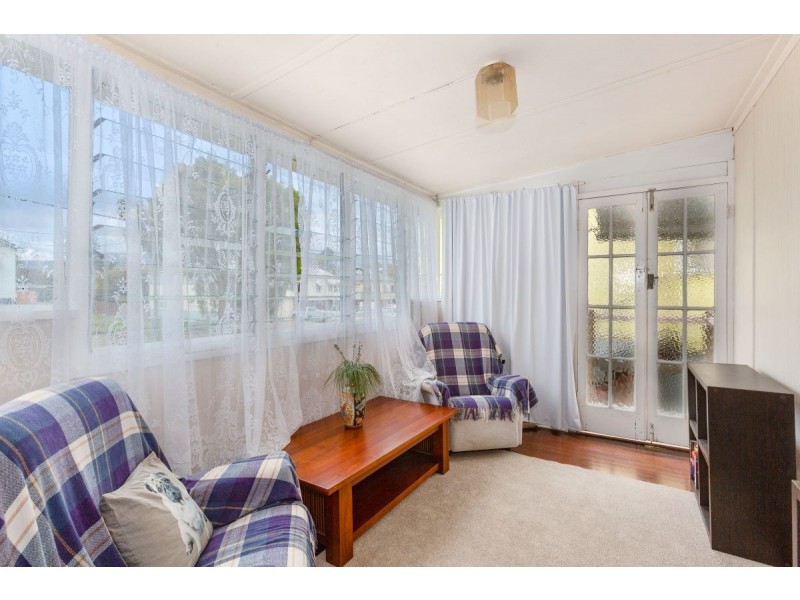
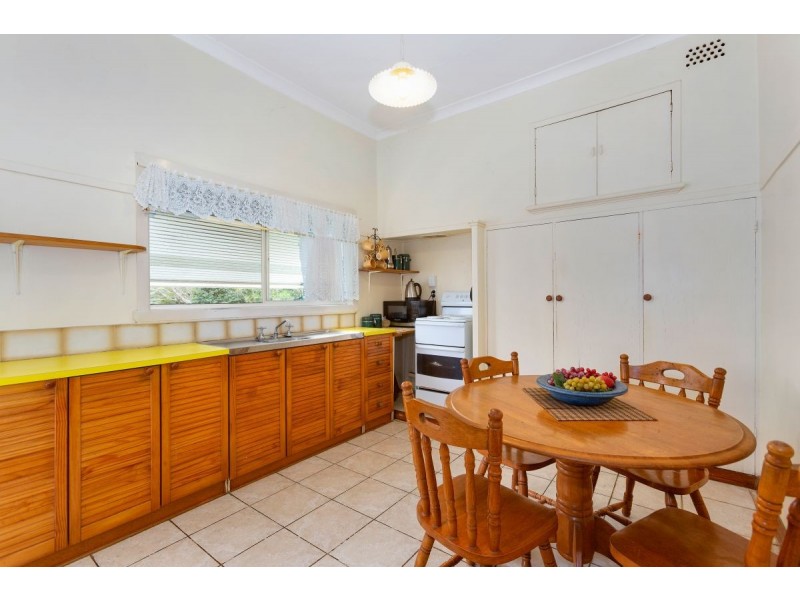
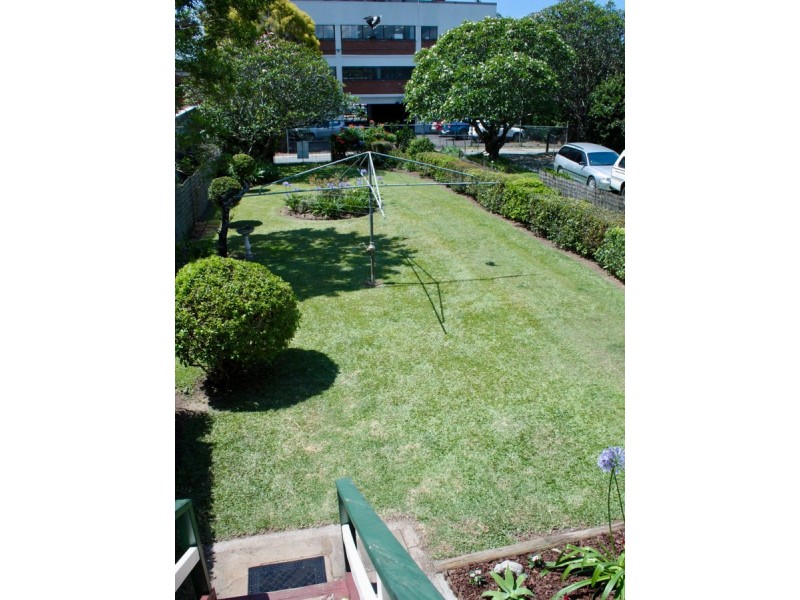
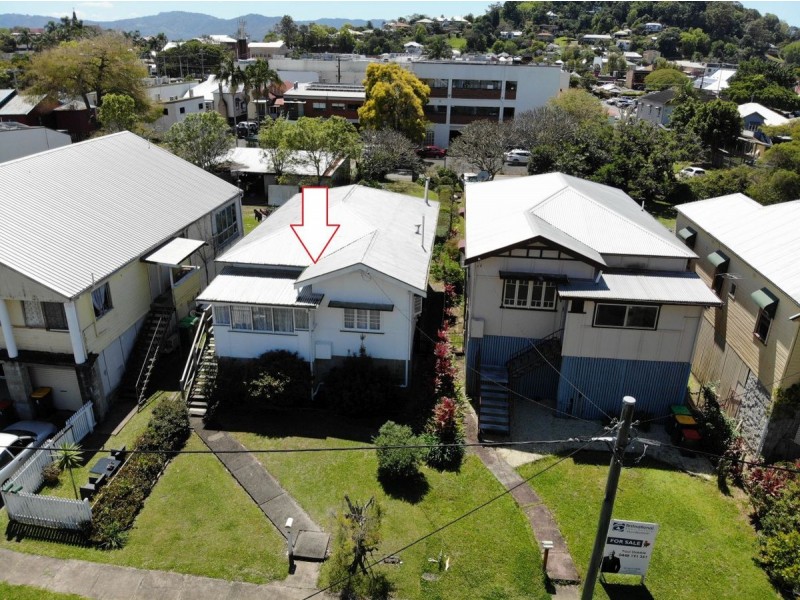
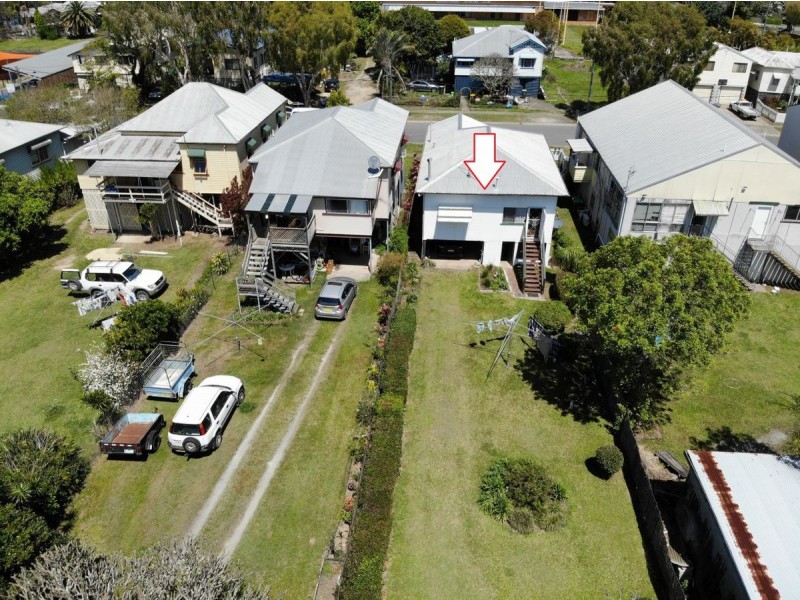
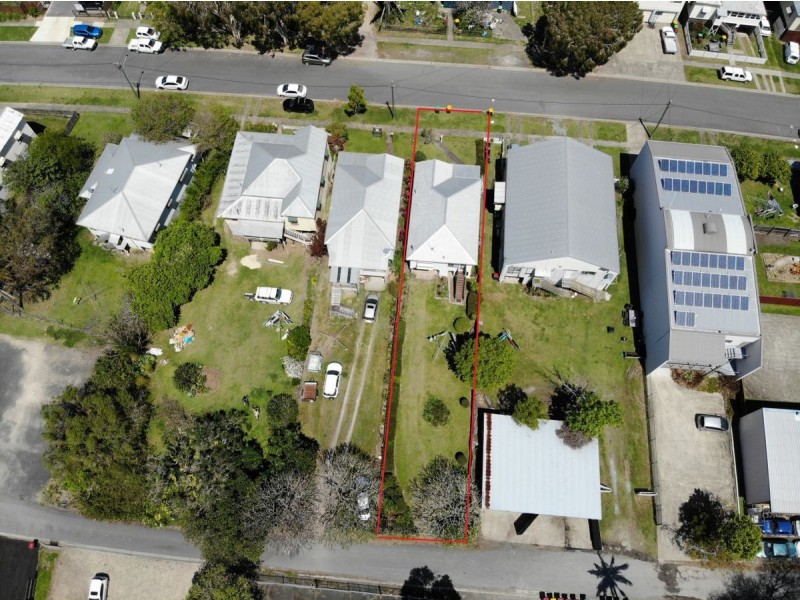
11 Prince Street, Murwillumbah NSW 2484 Business or Pleasure $399,000 Listing history: 7 Nov, 2017 4 Oct, 2018 1 Nov, 2018 2 1 2 Listing ID: 37005713 Other properties for sale near 11 Prince Street, Murwillumbah NSW 2484 24 PRINCE STREET, Murwillumbah NSW 2484 27 Prince Street, Murwillumbah NSW 2484 11 Prince Street, Murwillumbah NSW 2484 9 Prince Street, Murwillumbah NSW 2484 25 Prince Street, Murwillumbah NSW 2484 Location THIS PROPERTY WAS SOLD Enquiry about this property Name* Email* Phone* Message* Send me regular newsletters from Homehound Have agents get in touch about similar properties within the area What is 8 + 20?* Receive email alerts for properties like this Email alerts Email* Send me regular newsletters from Homehound. Have agents get in touch about similar properties within the area What is 8 + 20?*