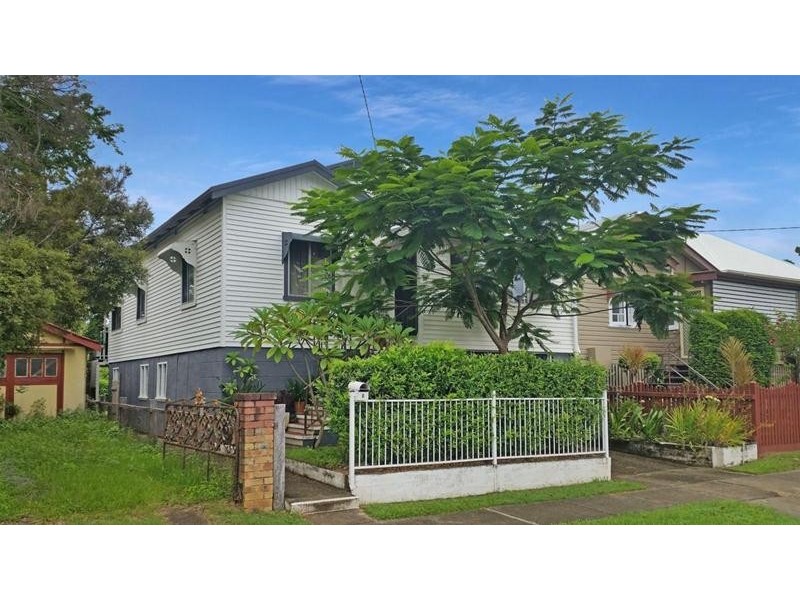
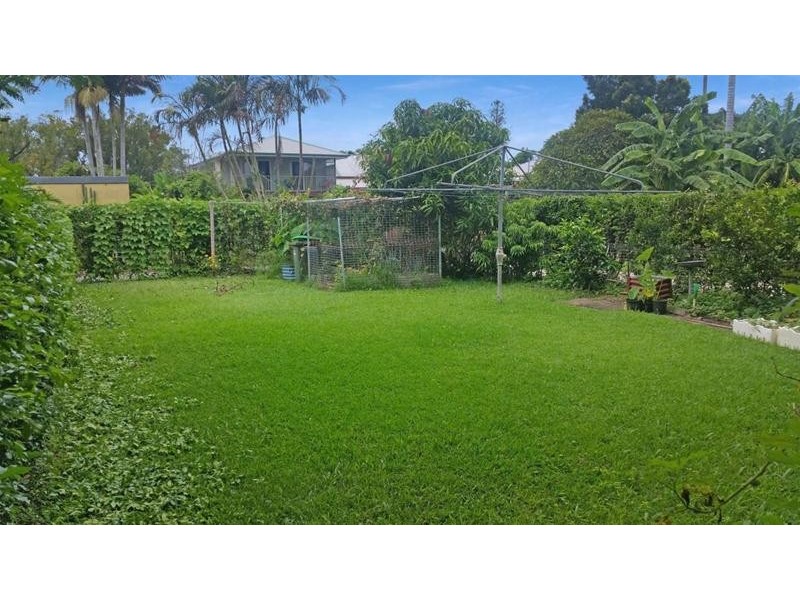
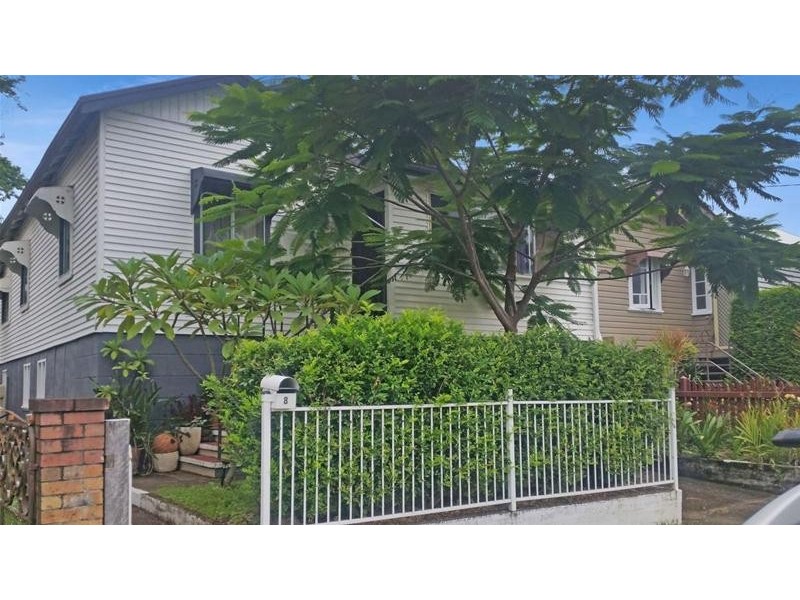
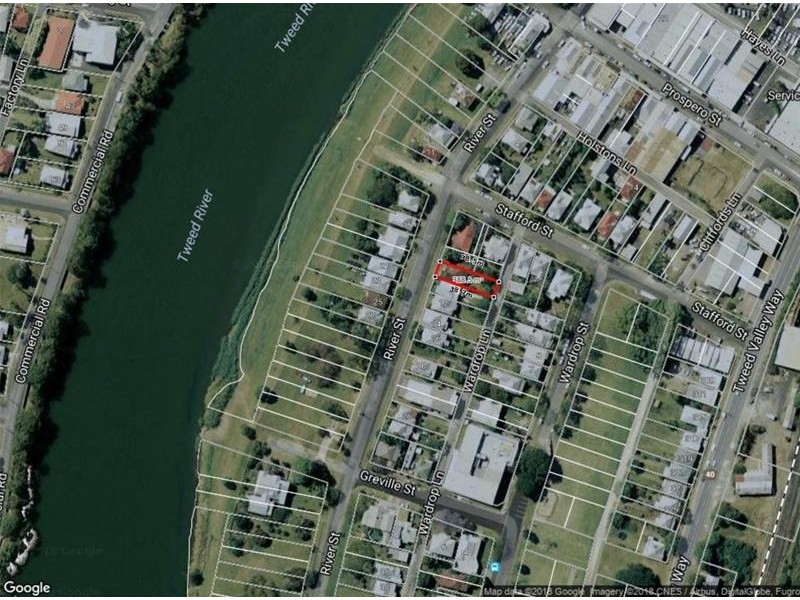
8 River Street, Murwillumbah NSW 2484 Best Value in Murwillumbah $399,000 Listing history: 27 Mar, 2018 3 1 1 Listing ID: 35984228 Other properties for sale near 8 River Street, Murwillumbah NSW 2484 96 River Street, South Murwillumbah NSW 2484 53 Riverview Street, Murwillumbah NSW 2484 1 William Street, Murwillumbah NSW 2484 5 Old Ferry Road, Murwillumbah NSW 2484 11 Reynolds Street, Murwillumbah NSW 2484 Location THIS PROPERTY WAS SOLD Enquiry about this property Name* Email* Phone* Message* Send me regular newsletters from Homehound Have agents get in touch about similar properties within the area What is 8 + 20?* Receive email alerts for properties like this Email alerts Email* Send me regular newsletters from Homehound. Have agents get in touch about similar properties within the area What is 8 + 20?*