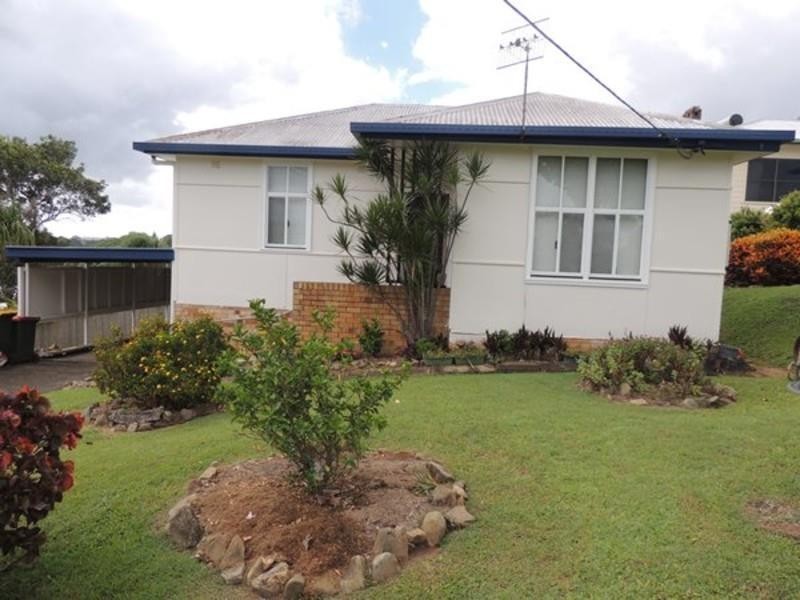
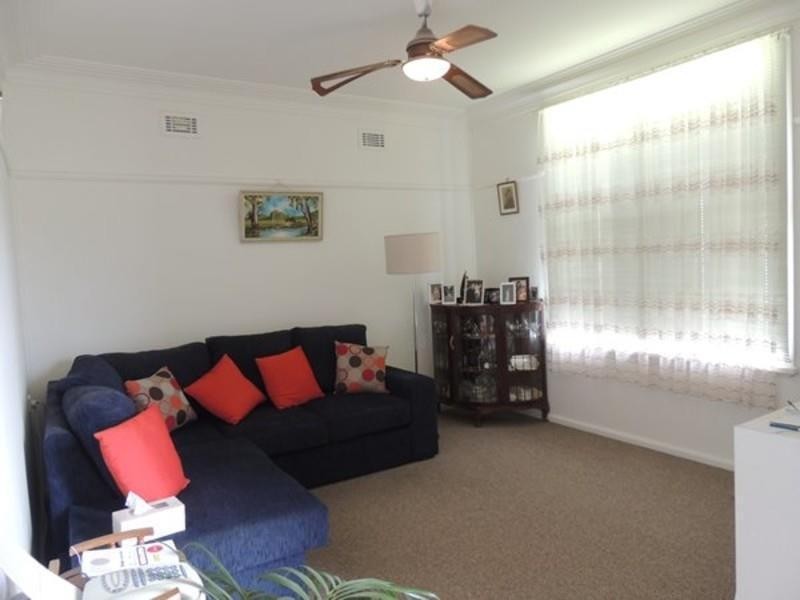
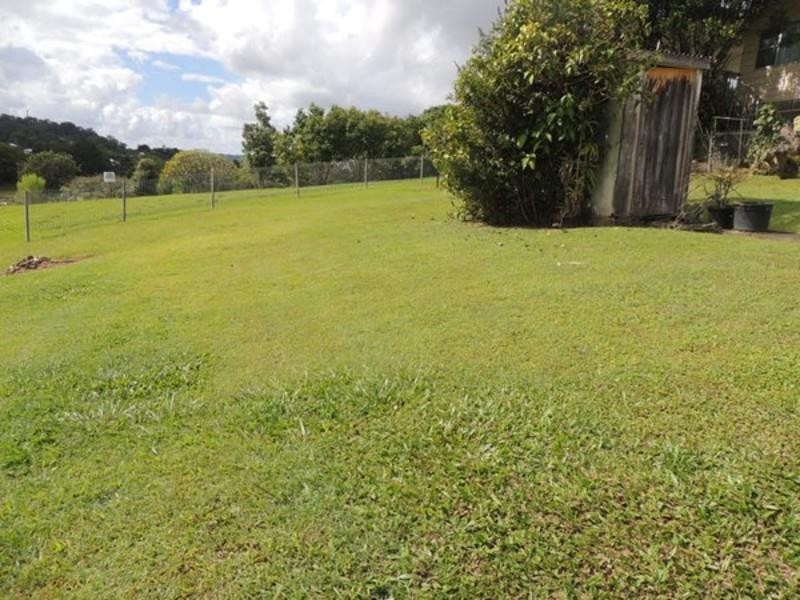
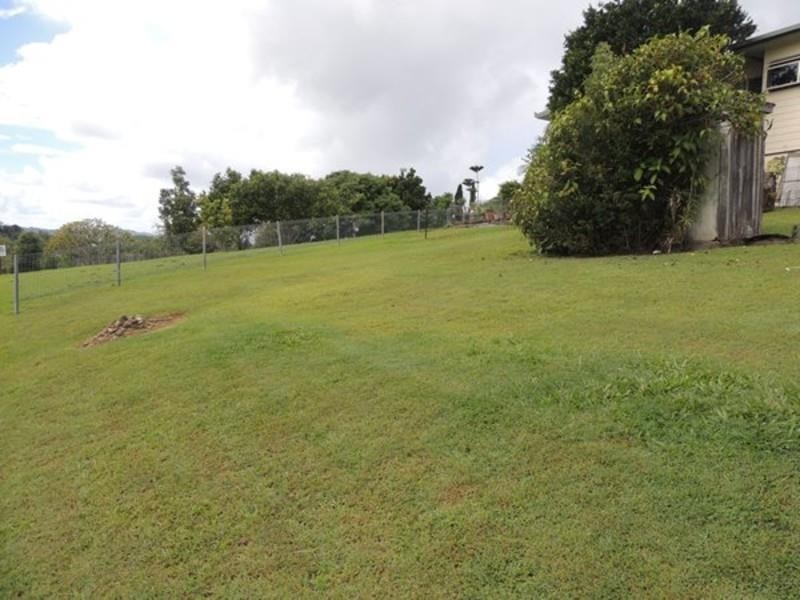
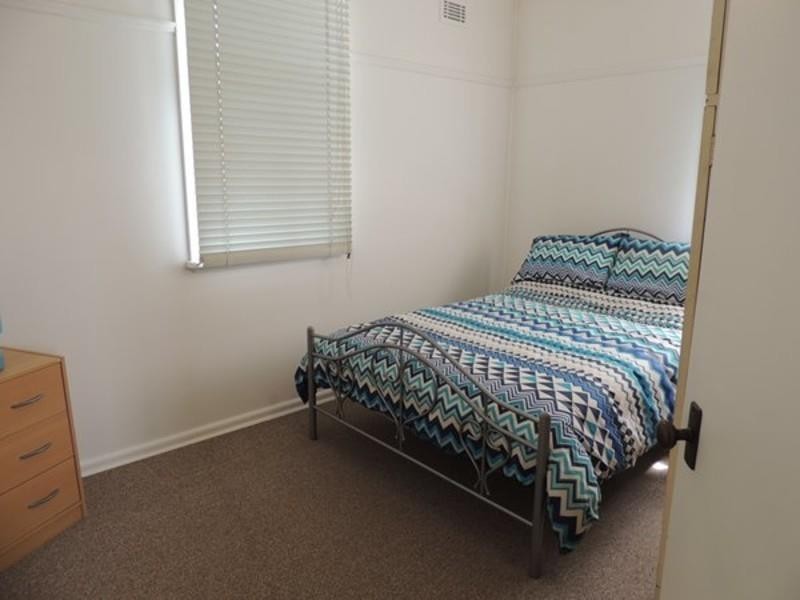
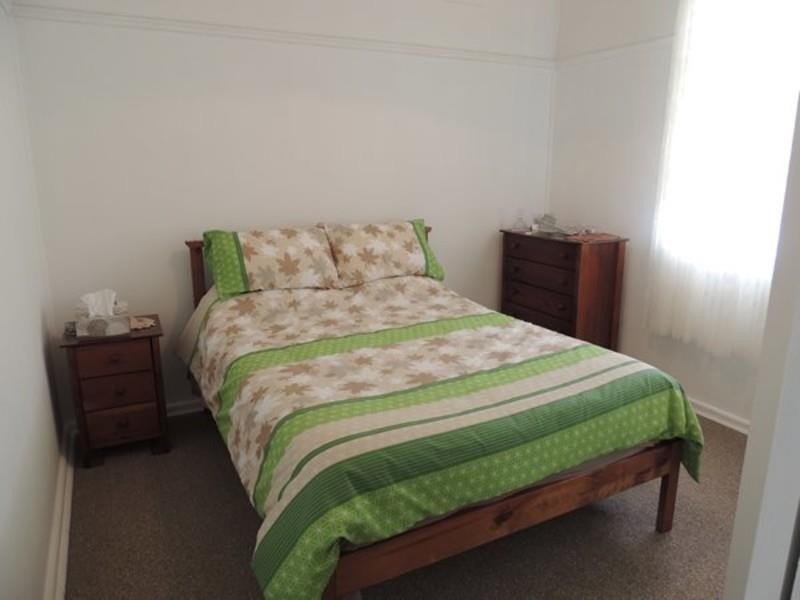
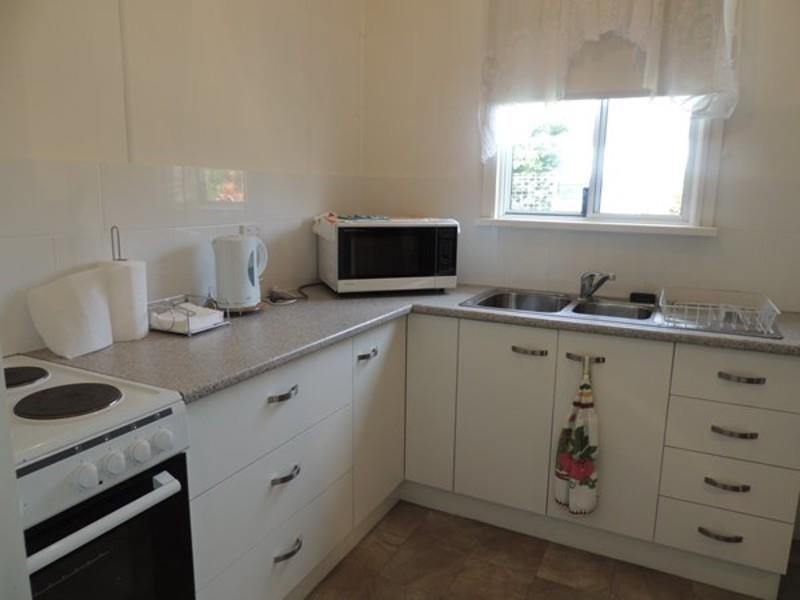
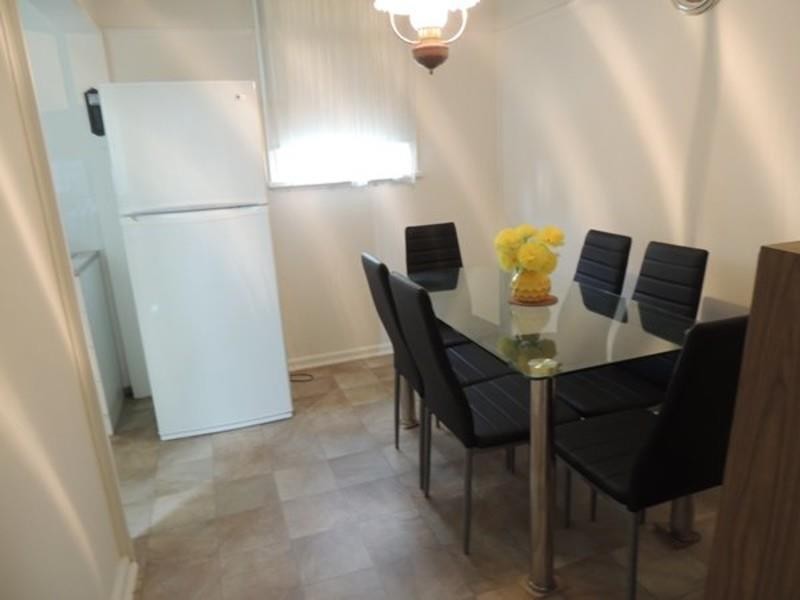
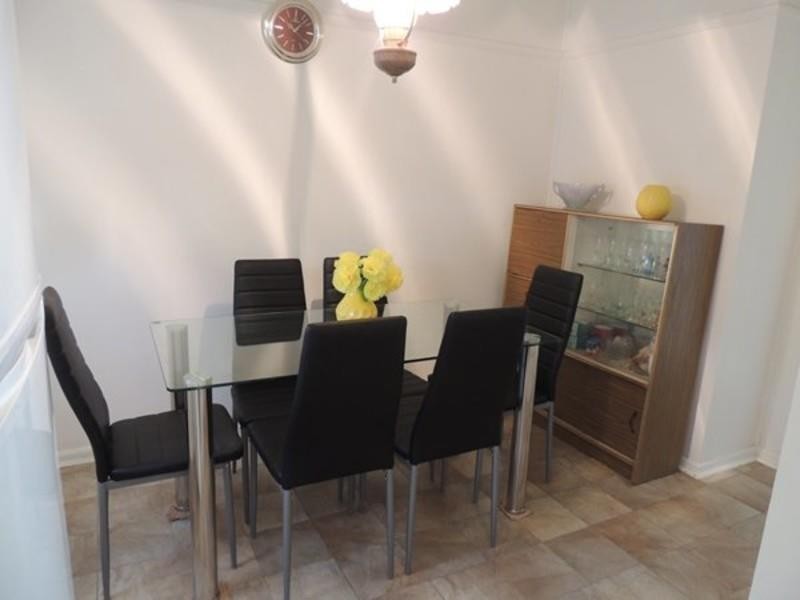
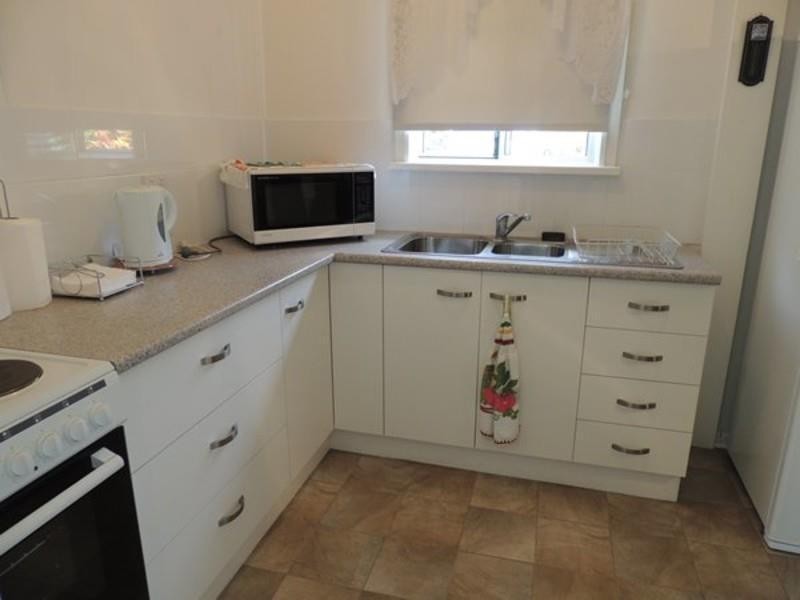
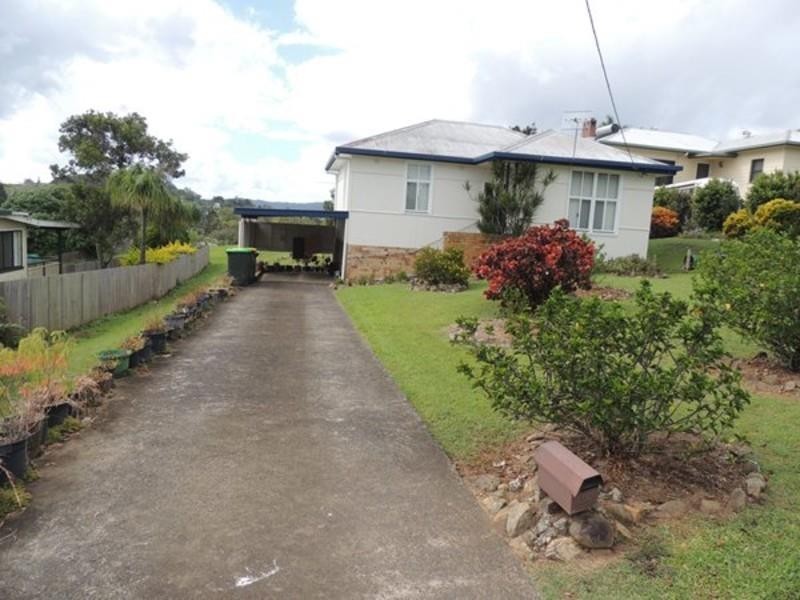
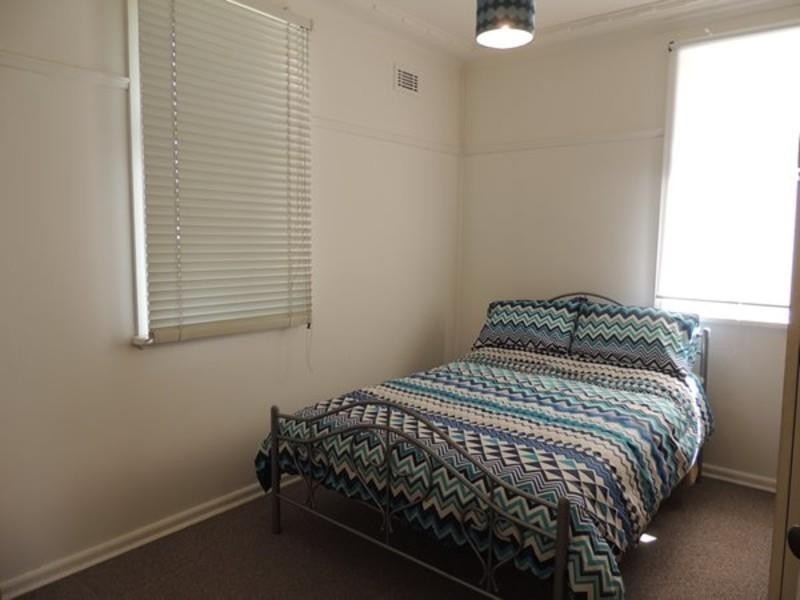
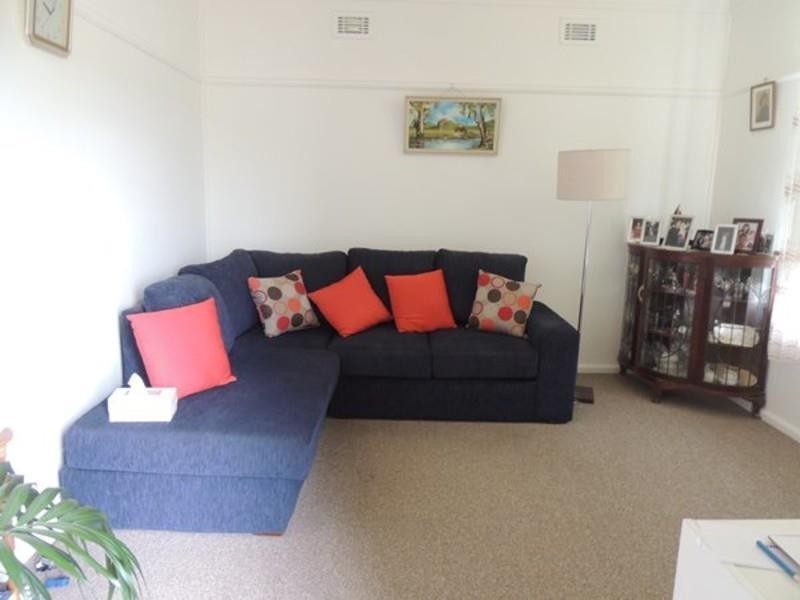
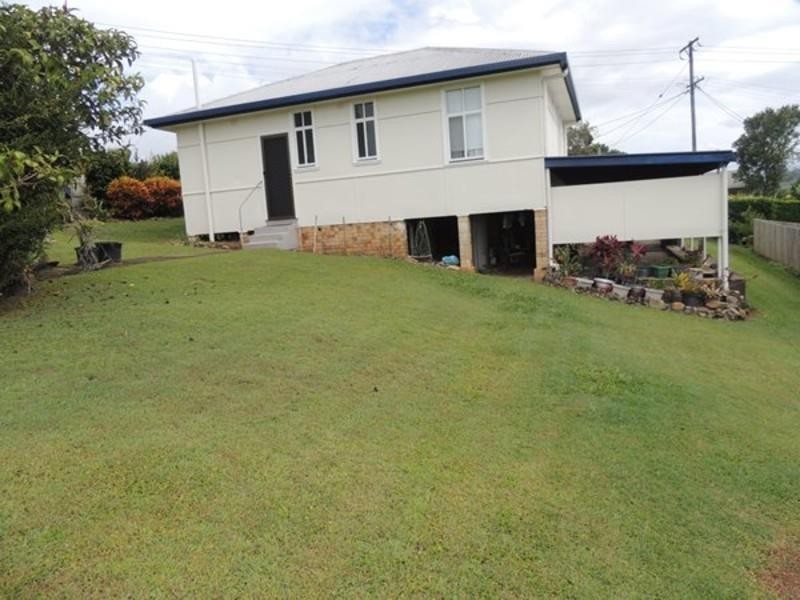
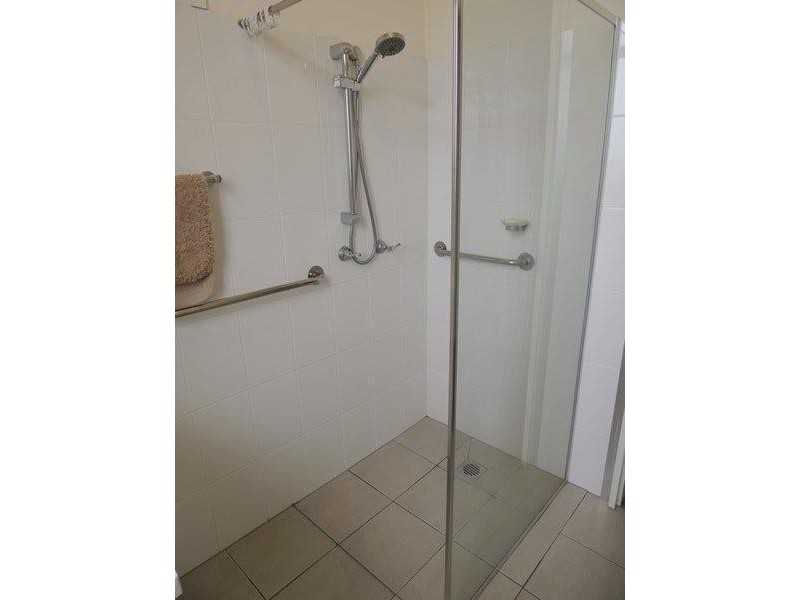
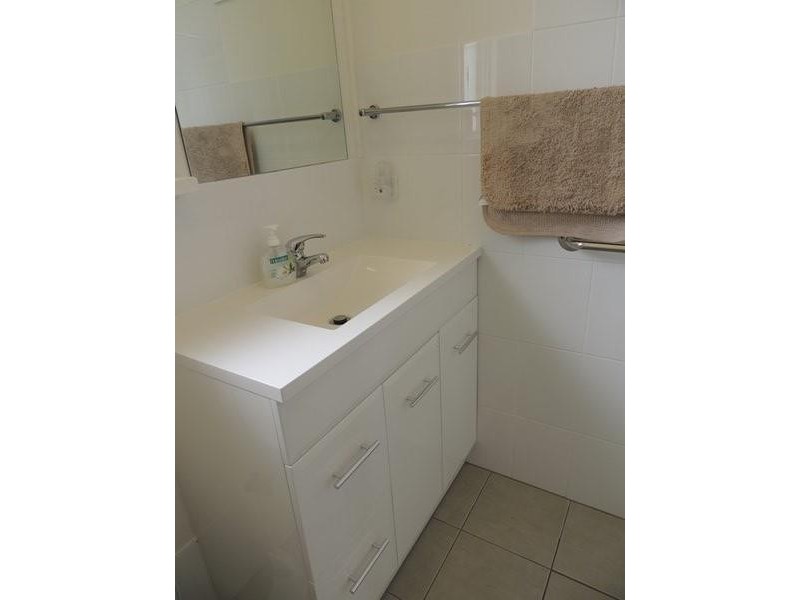
4 Barnby Street, Murwillumbah NSW 2484 GRAB THIS ONE TODAY!!! $355,000 Listing history: 26 Apr, 2017 2 1 0 Listing ID: 33898483 Other properties for sale near 4 Barnby Street, Murwillumbah NSW 2484 8 Barnby Street, Murwillumbah NSW 2484 53 Barnby Street, Murwillumbah NSW 2484 Location THIS PROPERTY WAS SOLD Enquiry about this property Name* Email* Phone* Message* Send me regular newsletters from Homehound Have agents get in touch about similar properties within the area What is 8 + 20?* Receive email alerts for properties like this Email alerts Email* Send me regular newsletters from Homehound. Have agents get in touch about similar properties within the area What is 8 + 20?*