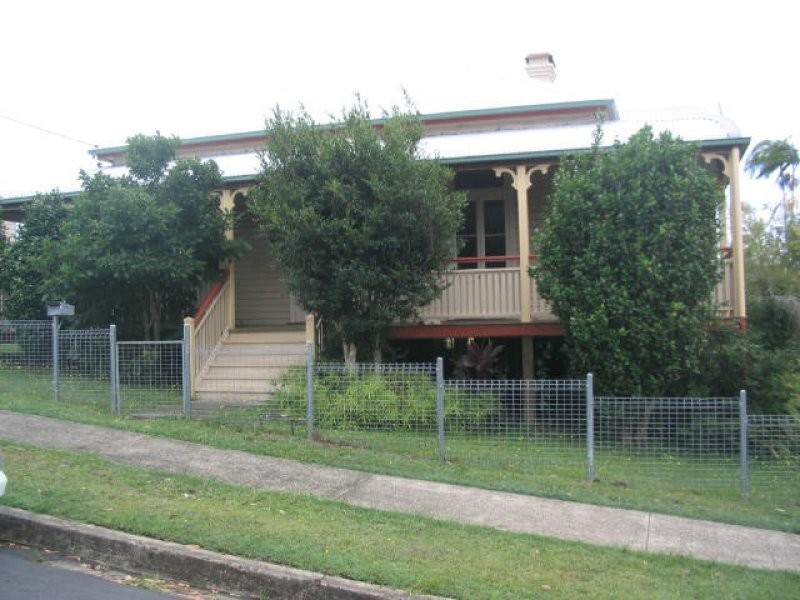
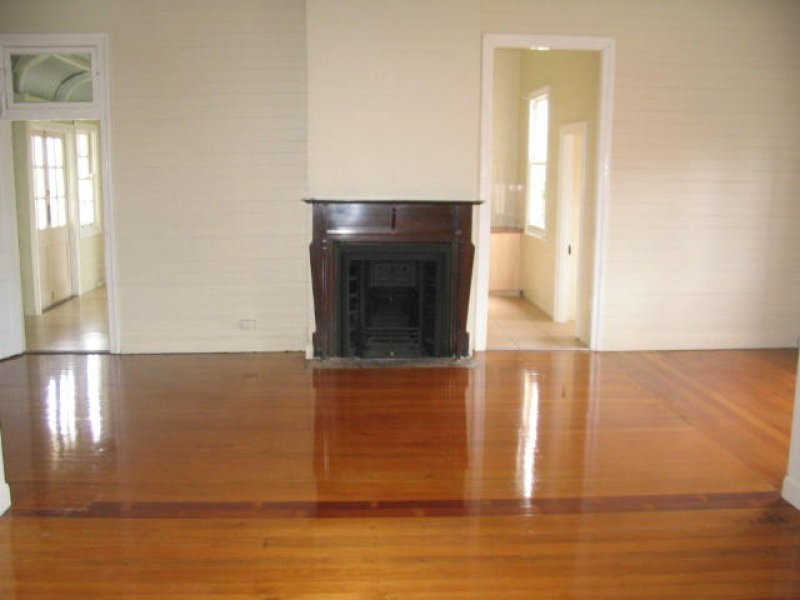
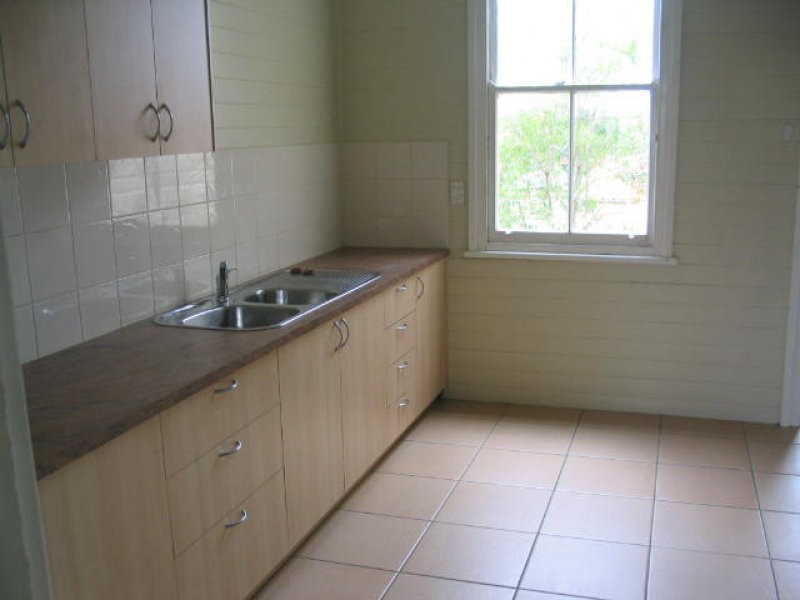
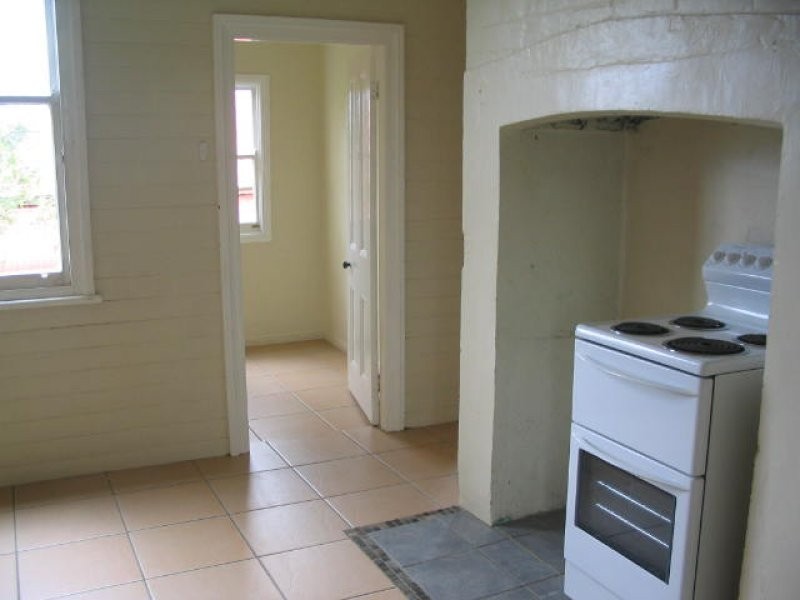
29 Prince Street, Murwillumbah NSW 2484 PENDING APPLICATIONS $420 3 1 1 Listing ID: 33219868 Other properties to rent near 29 Prince Street, Murwillumbah NSW 2484 12 Charles Street, Murwillumbah NSW 2484 16 Mayal Street, Murwillumbah NSW 2484 Unit 1/ 33 Countryside Drive, Murwillumbah NSW 2484 151a Murwillumbah Street, Murwillumbah NSW 2484 196 Murwillumbah Street, Murwillumbah NSW 2484 Location THIS PROPERTY WAS LEASED Enquiry about this property Name* Email* Phone* Message* Send me regular newsletters from Homehound Have agents get in touch about similar properties within the area What is 8 + 20?* Receive email alerts for properties like this Email alerts Email* Send me regular newsletters from Homehound. Have agents get in touch about similar properties within the area What is 8 + 20?*