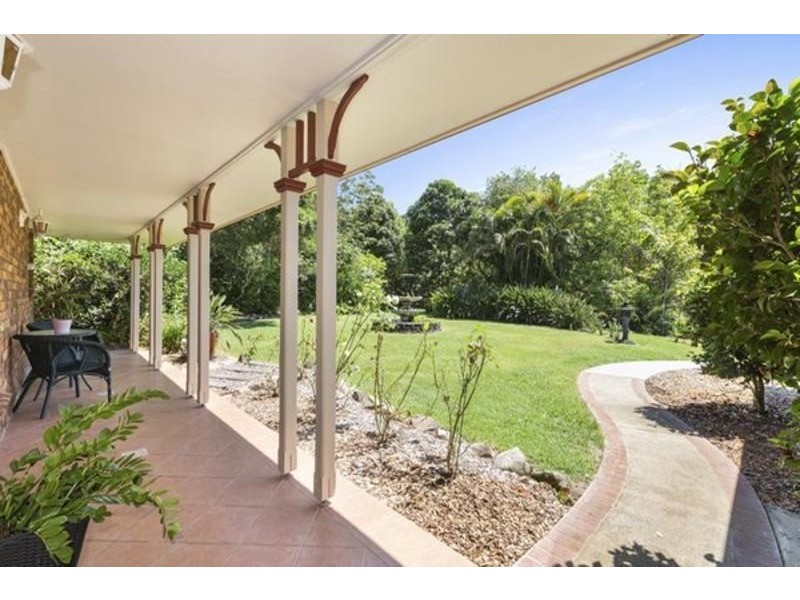
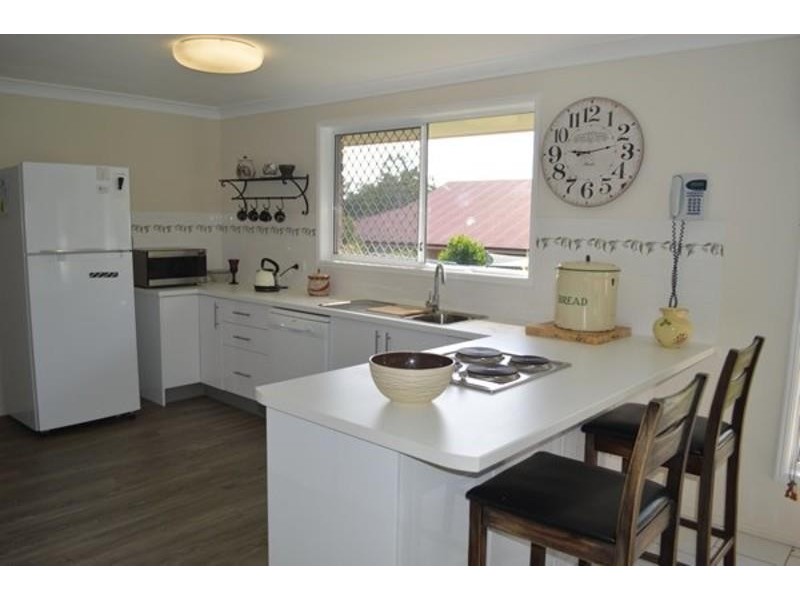
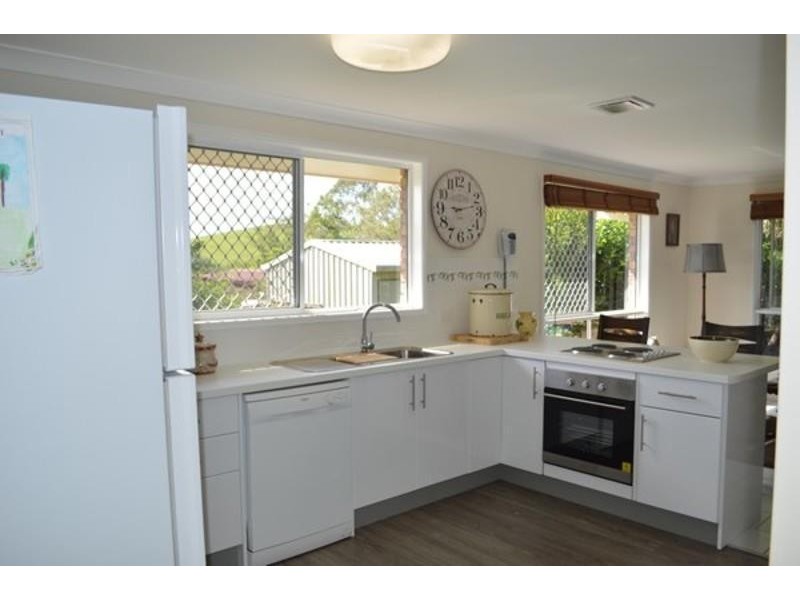
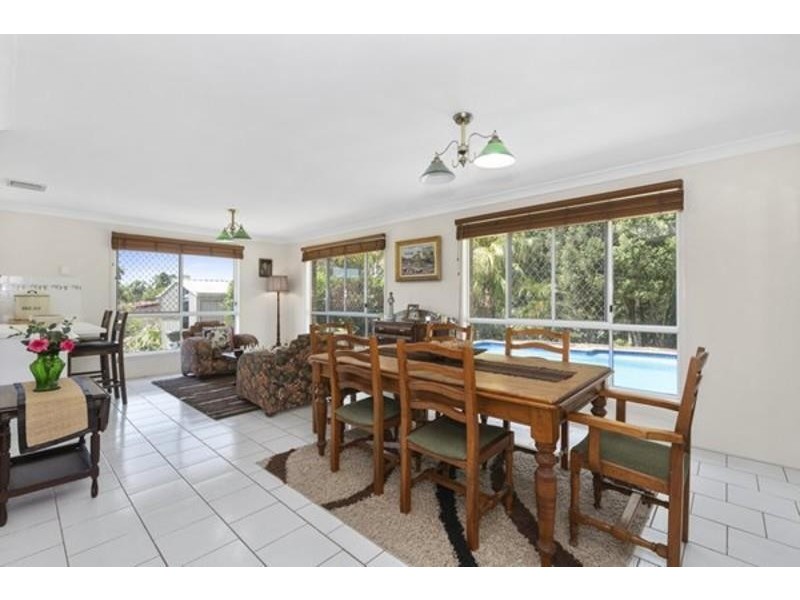
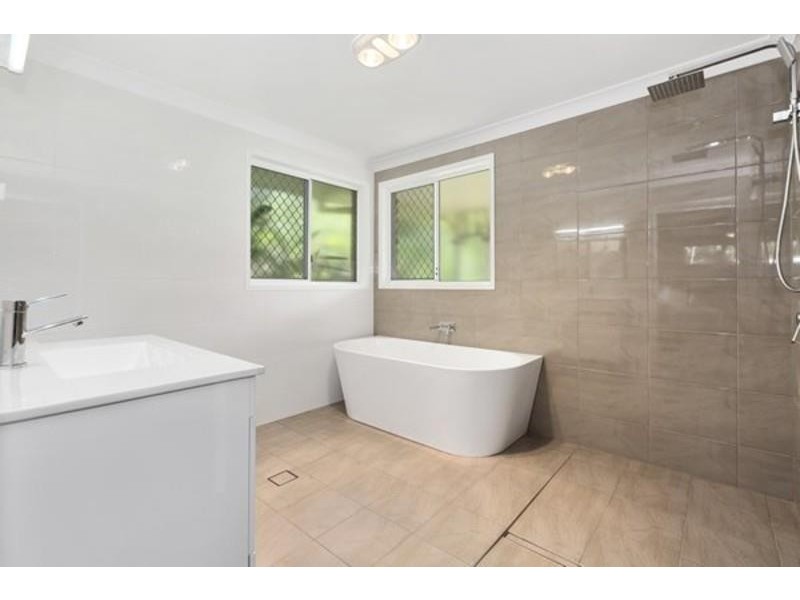
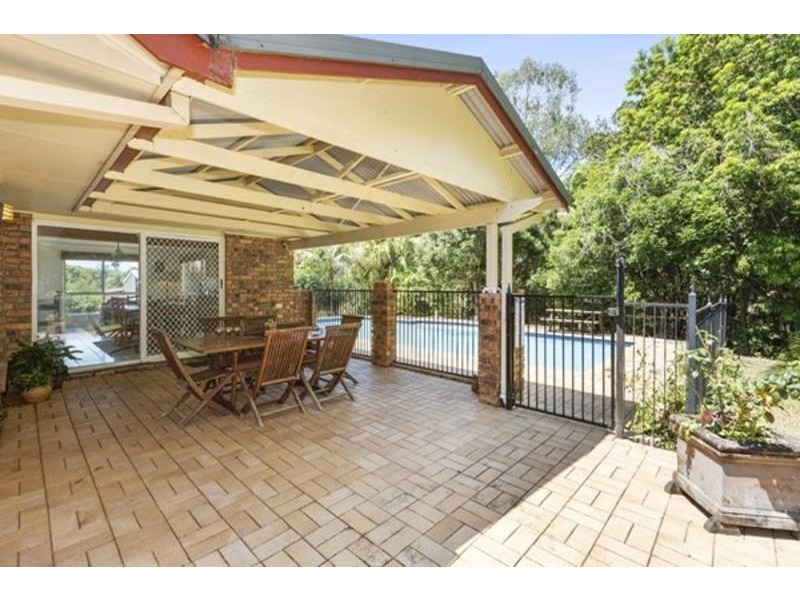
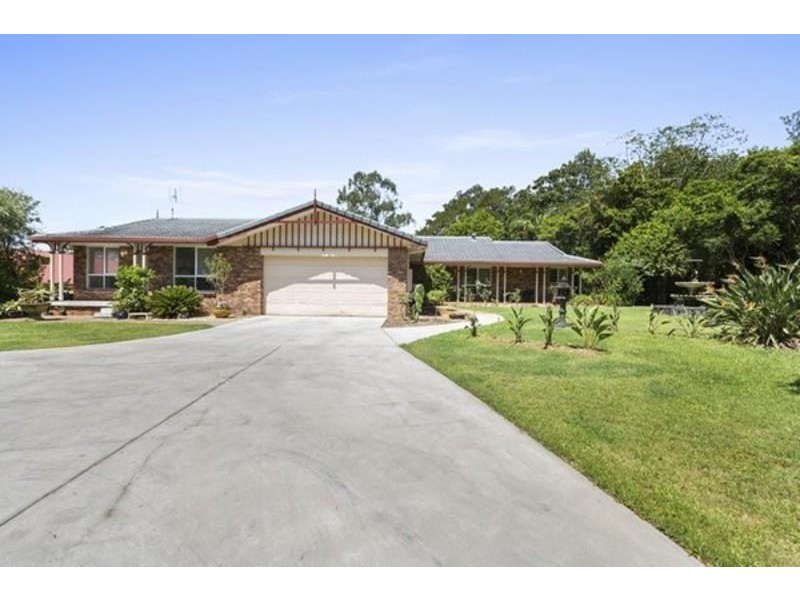
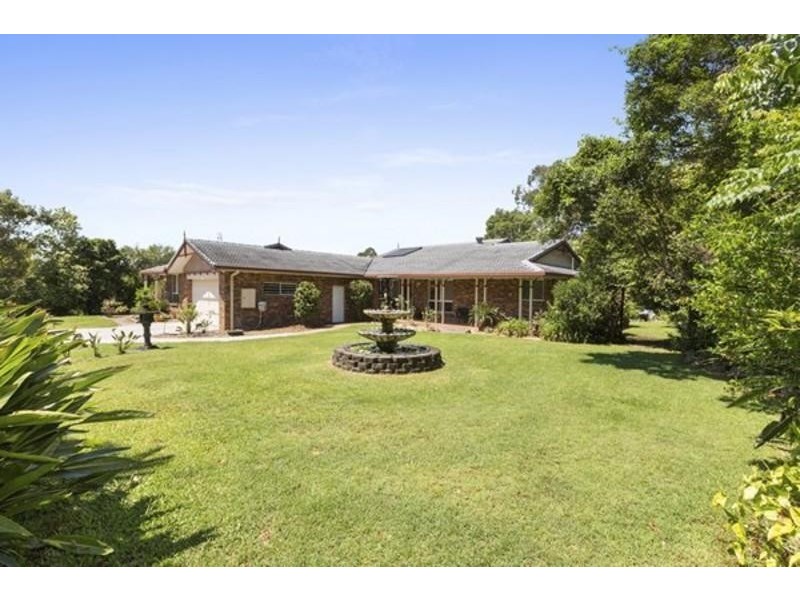
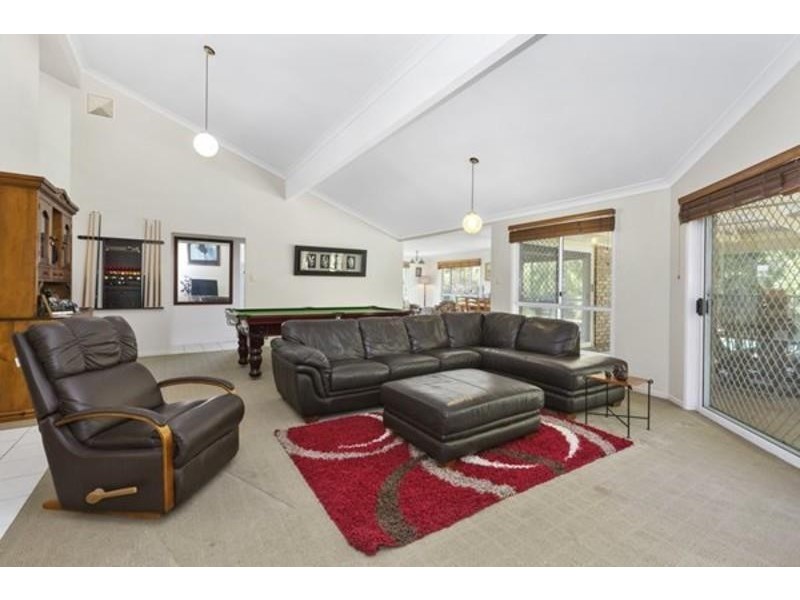
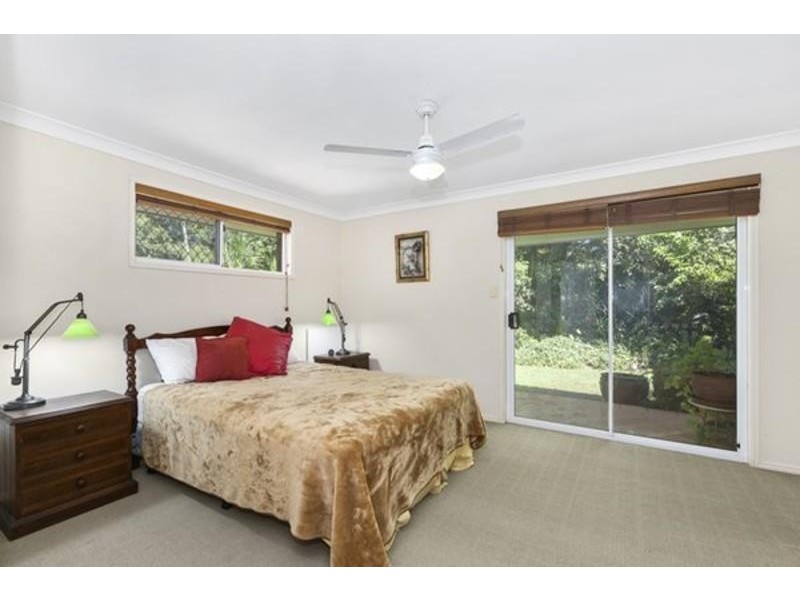
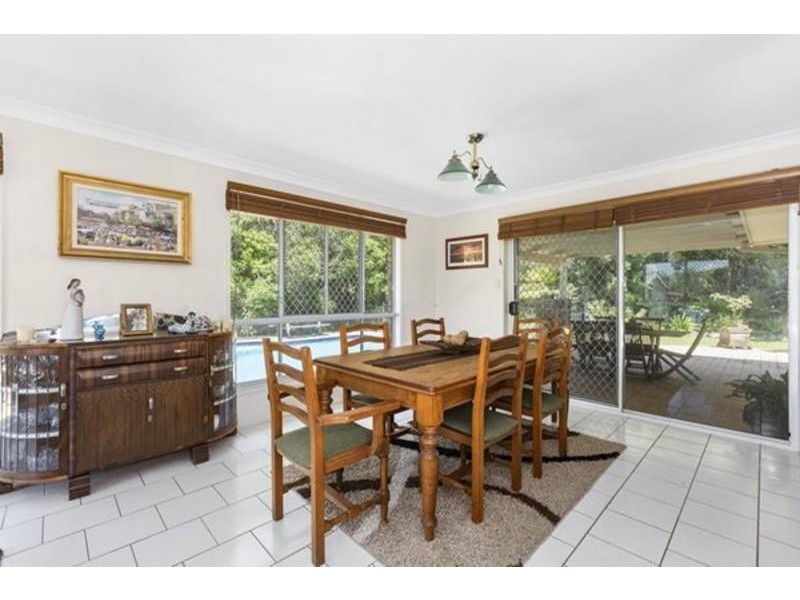
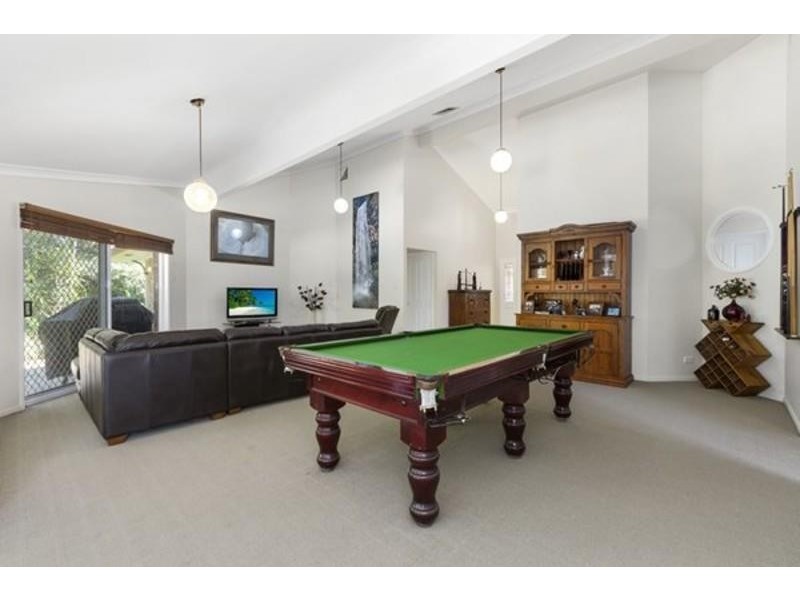
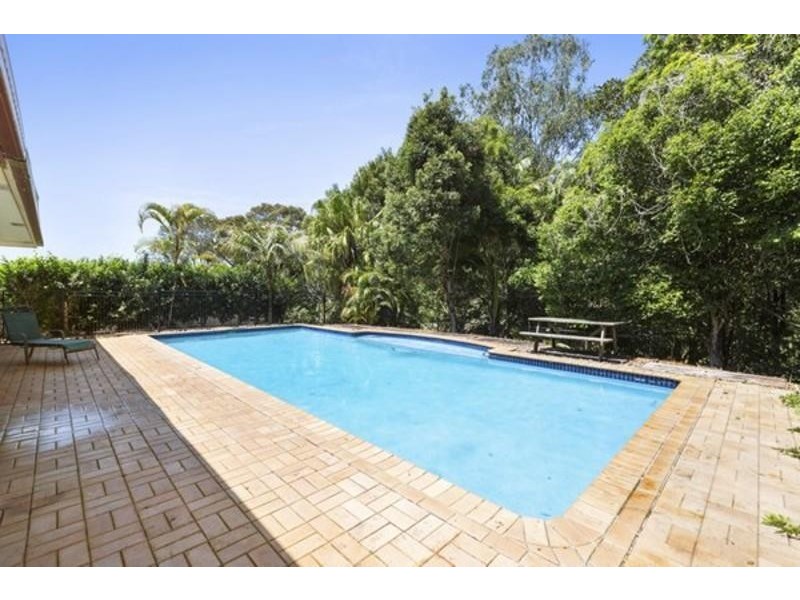
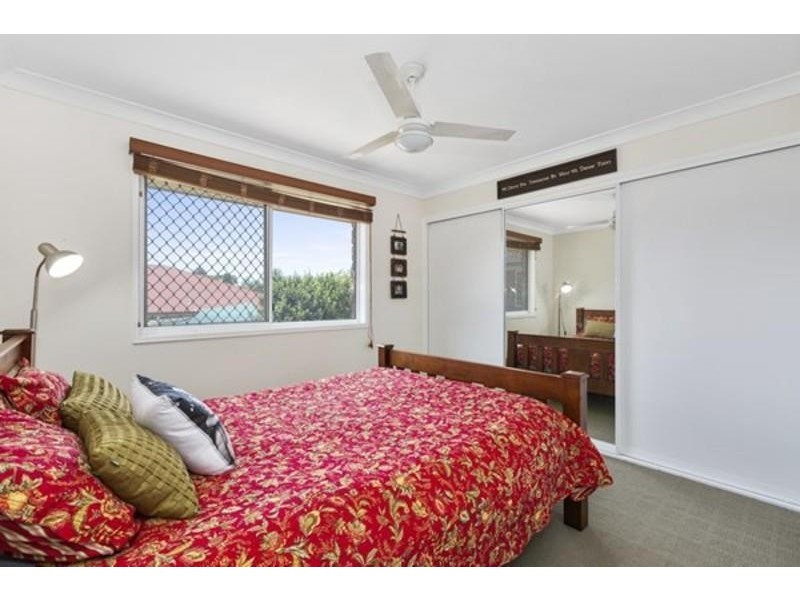
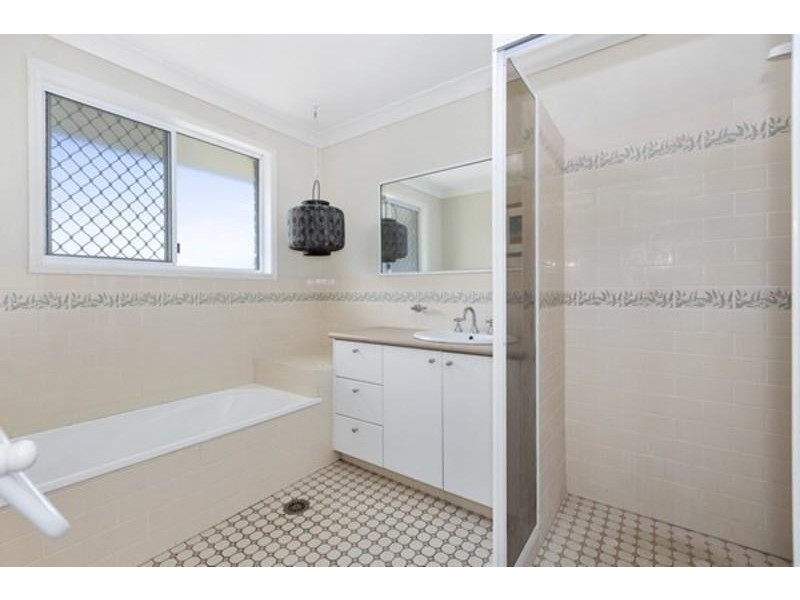
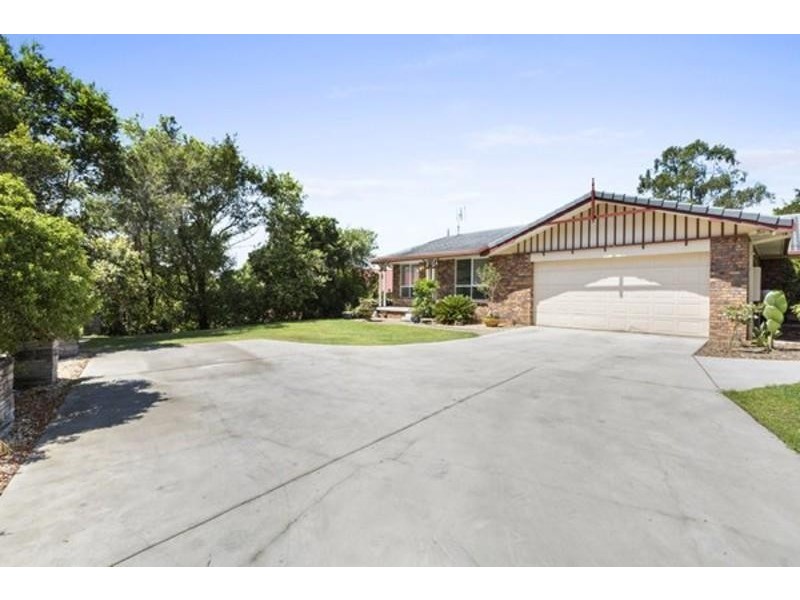
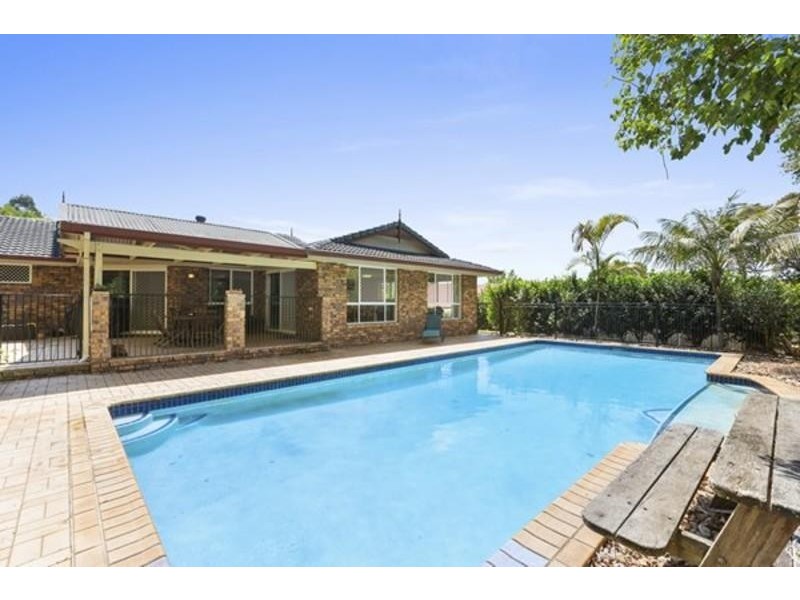
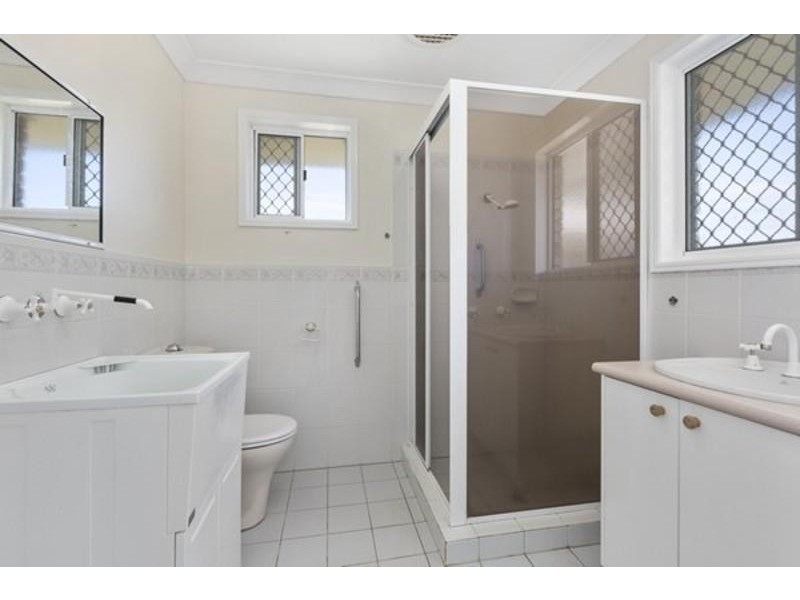
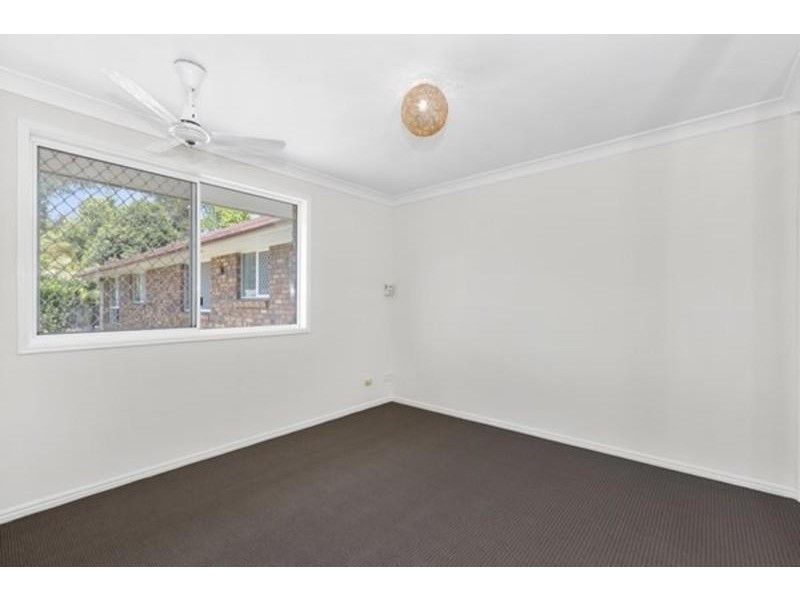
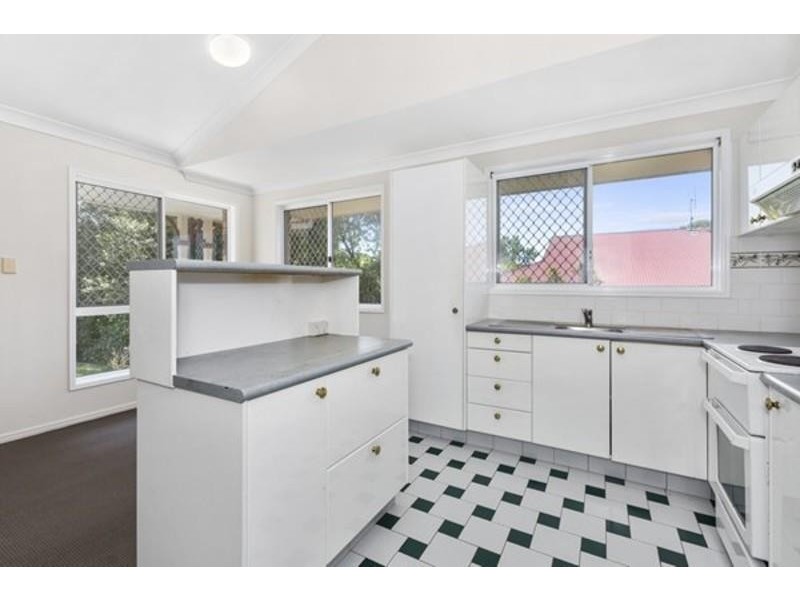
There are approximately 18,049 people living in Murwillumbah but… who are they?
44
49%
51%
Suburb Stats
$834/WK
$250/WK
$382/WK
Value of property in Murwillumbah and nearby suburbs
Murwillumbah
Lennox Head
Goonellabah
North Tumbulgum
Average Home Price$478,633Average Rental Price$346Household Size2.5
Average Home Price$928,442Average Rental Price$545Household Size2.3
Average Home Price$407,924Average Rental Price$317Household Size2.4
Average Home Price$1,032,462Average Rental Price$511Household Size2.7
Water Useper year per person
0.6mln. litres
State Average 0.74 mln. litres
Nat. Average 0.74 mln. litres
Greenhouse Pollutionper year per person
16.48tonnes
State Average 19.31 tonnes
Nat. Average 20.3 tonnes
Dwelling Types
91%
5%
3%
Most Common Suburb Professions
17% Professio…
15% Technicia…
14% Managers…
12% Labourers…
Nearby schools: murwillumbah south infants school, murwillumbah east primary school, mt st patrick college, murwillumbah community college
Nearby cafes: dabelles cafe, cenzo cafe, fish bowl cafe, the blue frog
Nearby doctors: king street dental practice, king street dental practice - dr. evans michael, king street medical centre-jenkins helen, king street medical centre-dr yabsley robyn
Nearby hospitals: murwillumbah district hospital, queen street medical centre, king street medical centre