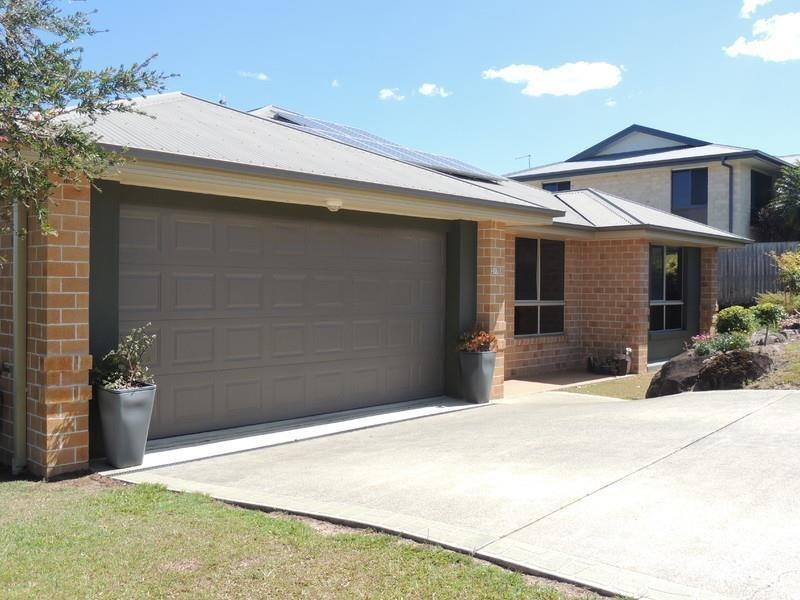
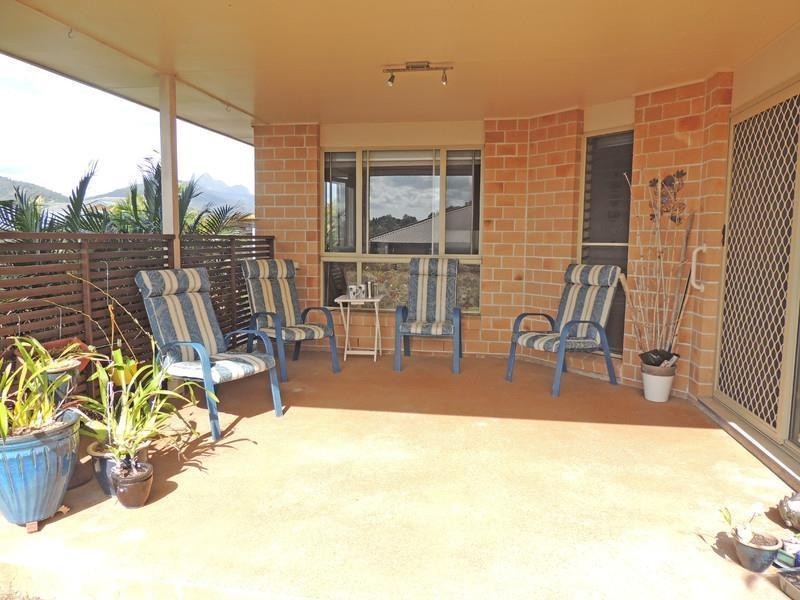
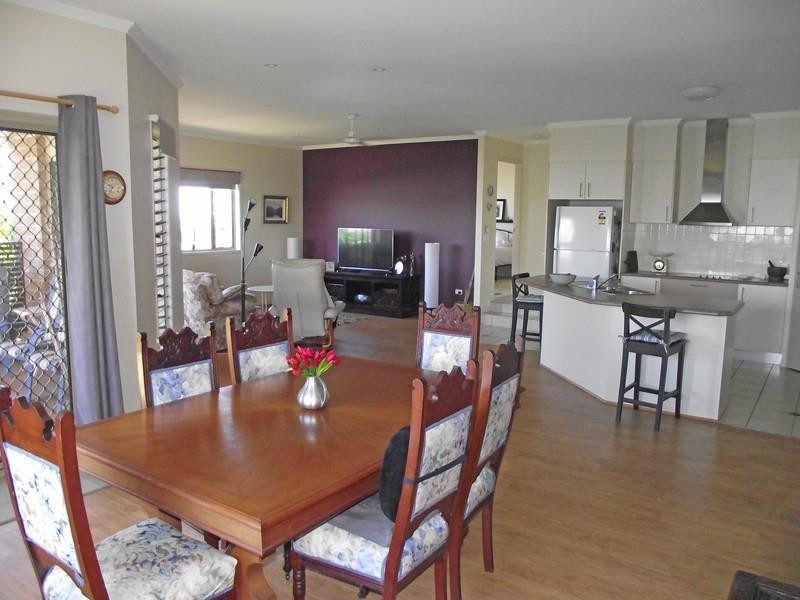
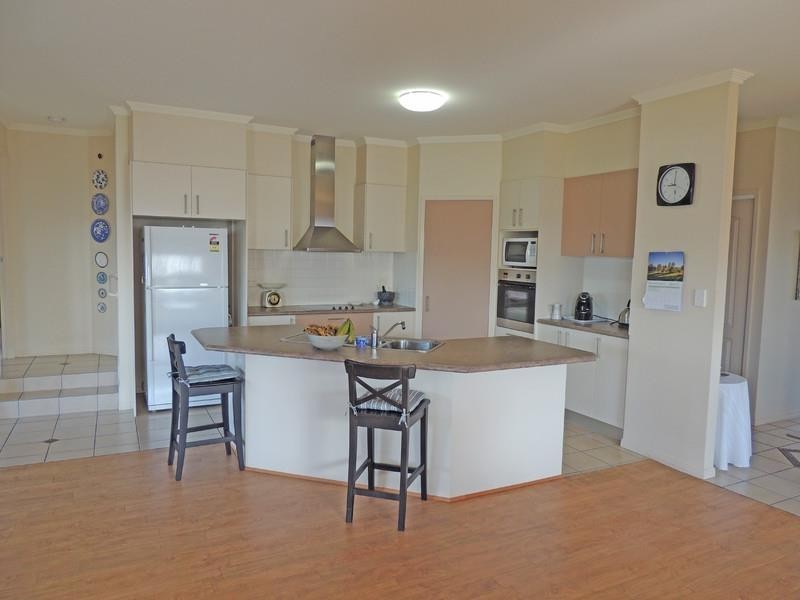
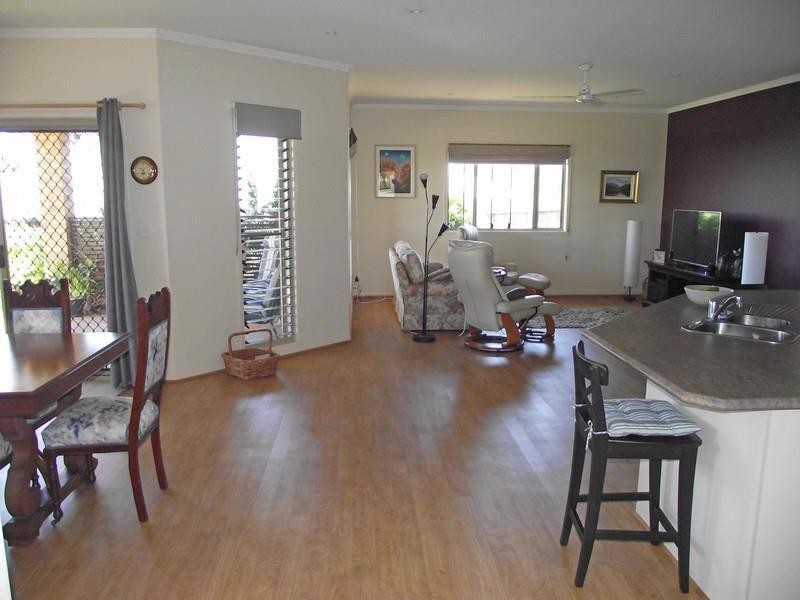
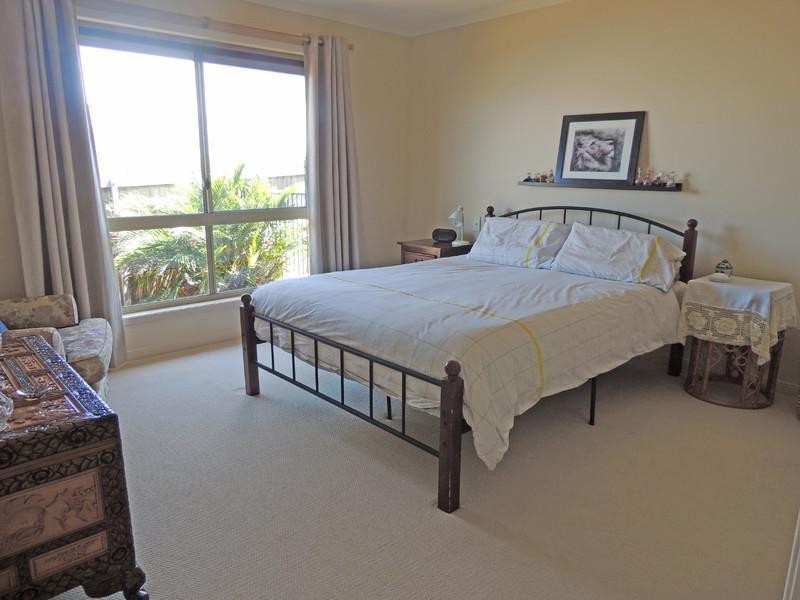
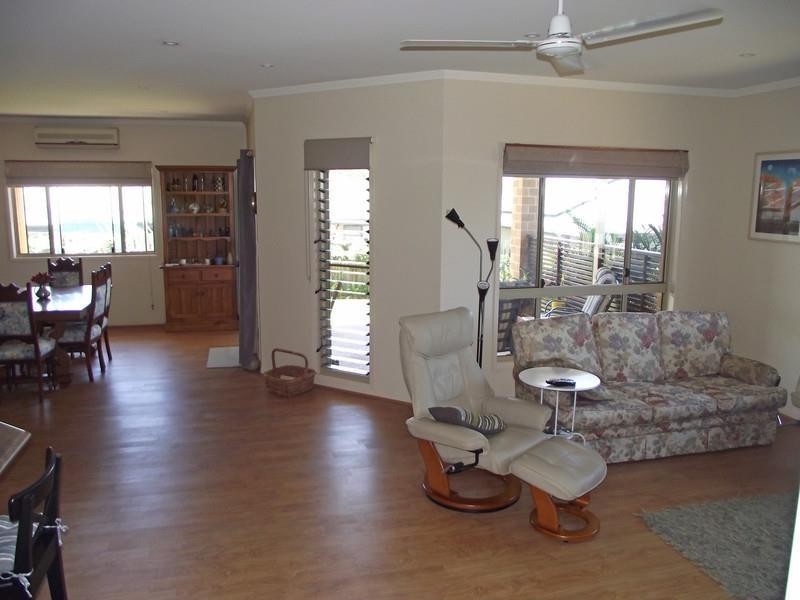
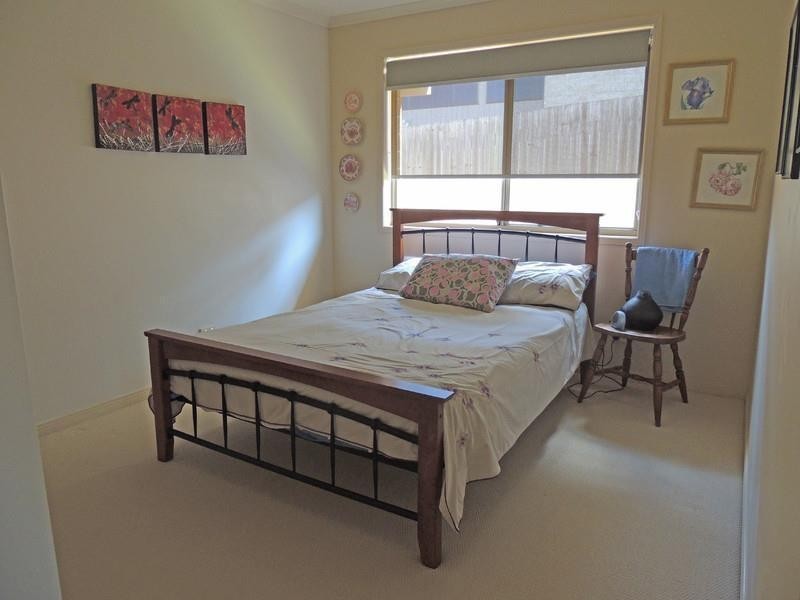
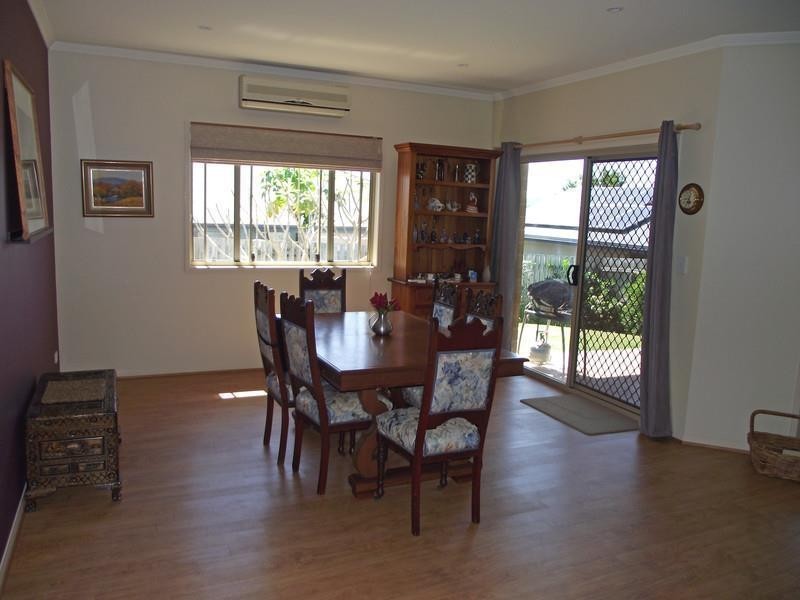
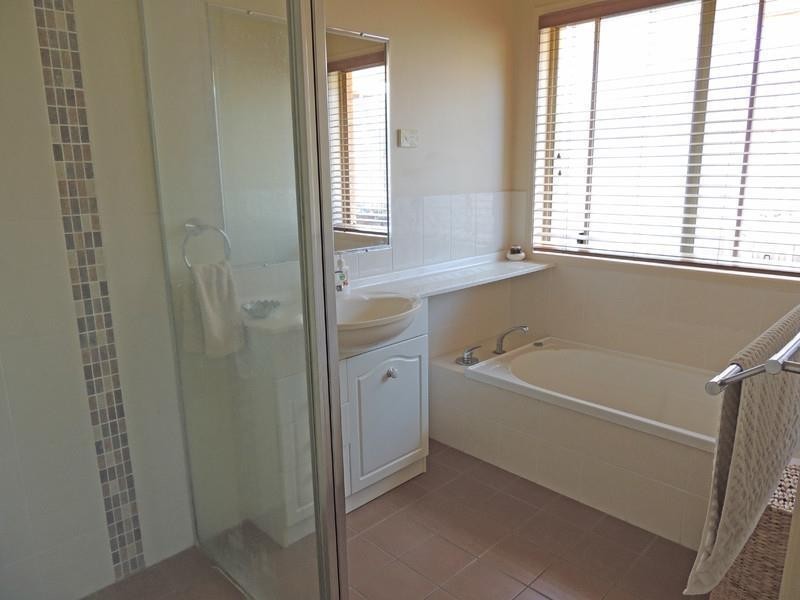
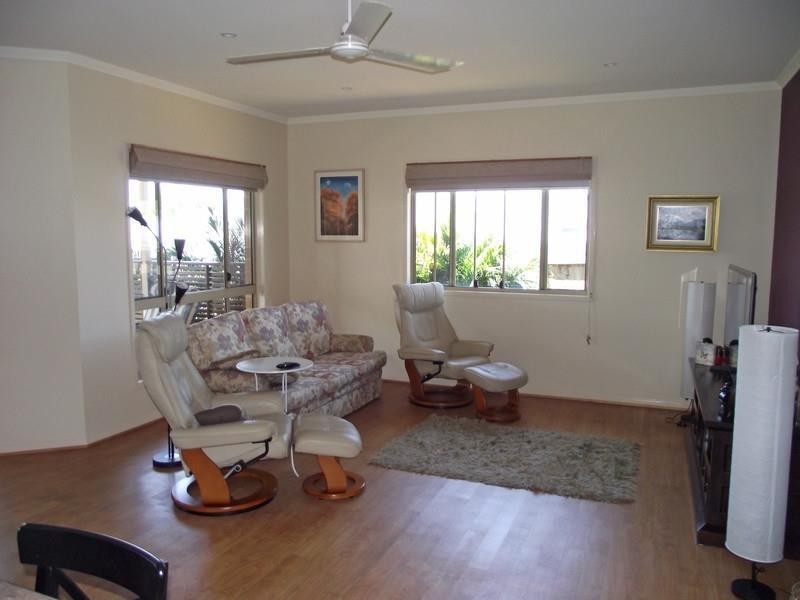
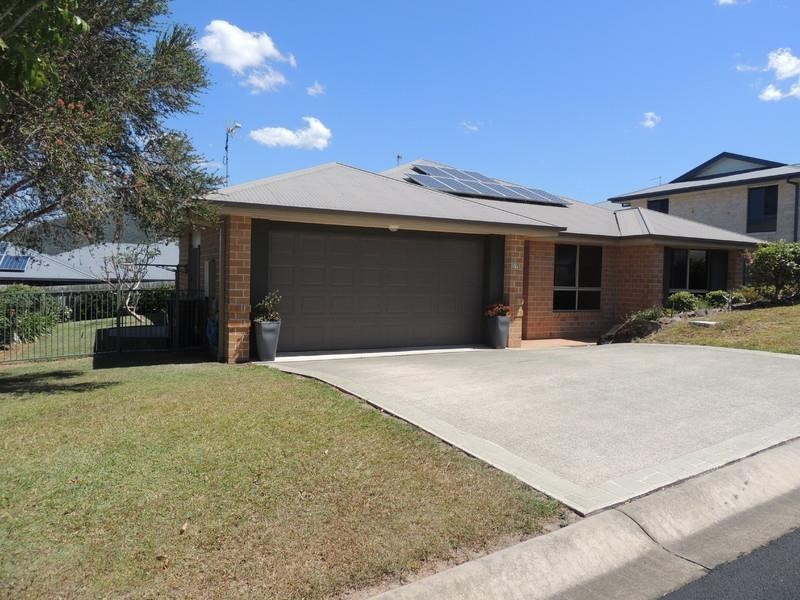
There are approximately 18,049 people living in Murwillumbah but… who are they?
44
49%
51%
Suburb Stats
$834/WK
$250/WK
$382/WK
Value of property in Murwillumbah and nearby suburbs
Murwillumbah
Nimbin
Boat Harbour
The Channon
Average Home Price$478,633Average Rental Price$346Household Size2.5
Average Home Price$463,353Average Rental Price$314Household Size2.4
Average Home Price$687,806Average Rental Price$536Household Size2.6
Average Home Price$573,525Average Rental Price$320Household Size2.4
Water Useper year per person
0.6mln. litres
State Average 0.74 mln. litres
Nat. Average 0.74 mln. litres
Greenhouse Pollutionper year per person
16.48tonnes
State Average 19.31 tonnes
Nat. Average 20.3 tonnes
Dwelling Types
91%
5%
3%
Most Common Suburb Professions
17% Professio…
15% Technicia…
14% Managers…
12% Labourers…
Nearby schools: murwillumbah south infants school, murwillumbah east primary school, murwillumbah community college, mt st patrick college
Nearby cafes: fish bowl cafe, king street cafe, the blue frog, sugar beat cafe
Nearby doctors: advanced radiology clinics murwillumbah, queen street medical centre, king street medical centre-dr alan secombe, king street medical centre- dr. j. stephenson
Nearby hospitals: queen street medical centre, murwillumbah district hospital, king street medical centre