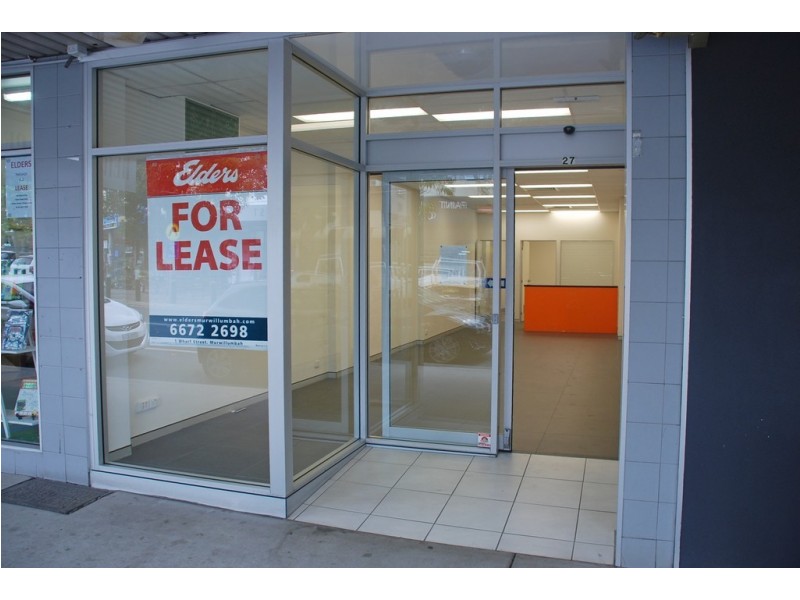
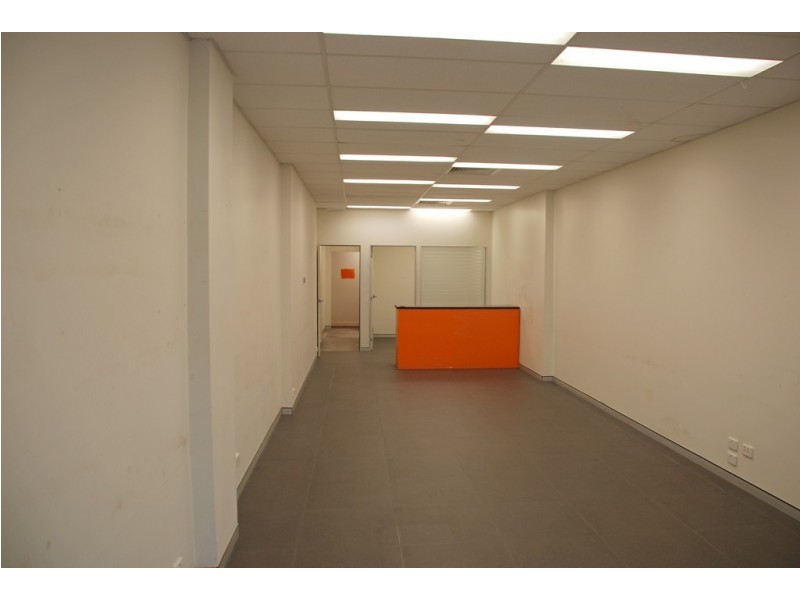
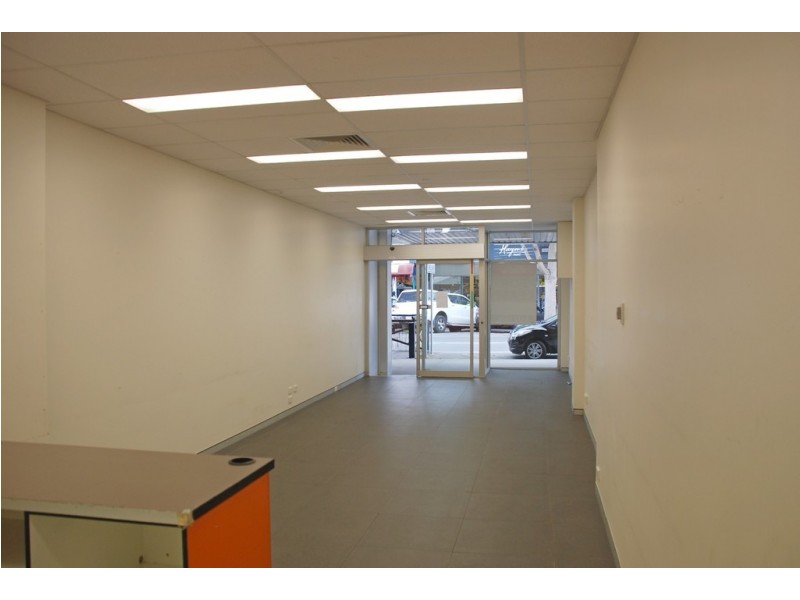
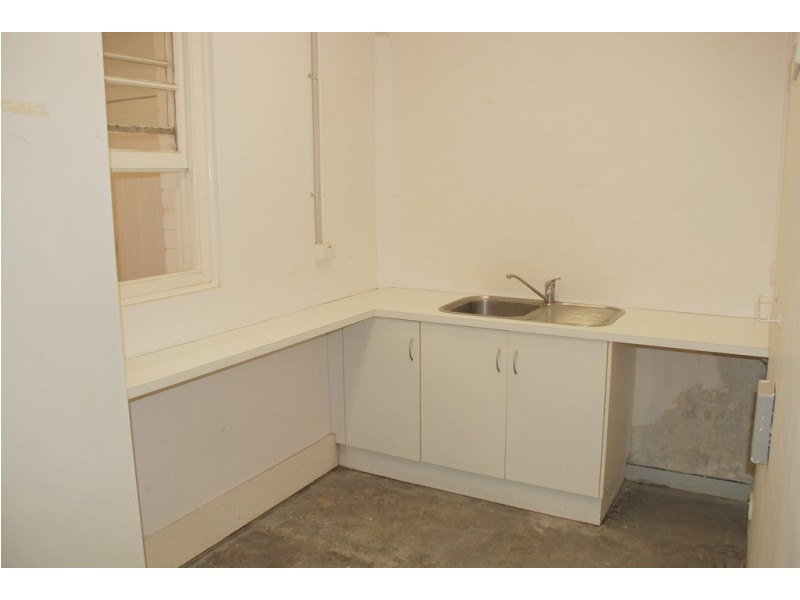
27 Wharf St, Murwillumbah NSW 2484 Wharf Street Retail shop $1450pcm+gst+o/goings Listing history: 18 Oct, 2016 0 0 0 Listing ID: 32583088 Other properties to rent near 27 Wharf St, Murwillumbah NSW 2484 Unit 5 3-5 Wharf Street, Murwillumbah NSW 2484 Location THIS PROPERTY WAS LEASED Enquiry about this property Name* Email* Phone* Message* Send me regular newsletters from Homehound Have agents get in touch about similar properties within the area What is 8 + 20?* Receive email alerts for properties like this Email alerts Email* Send me regular newsletters from Homehound. Have agents get in touch about similar properties within the area What is 8 + 20?*