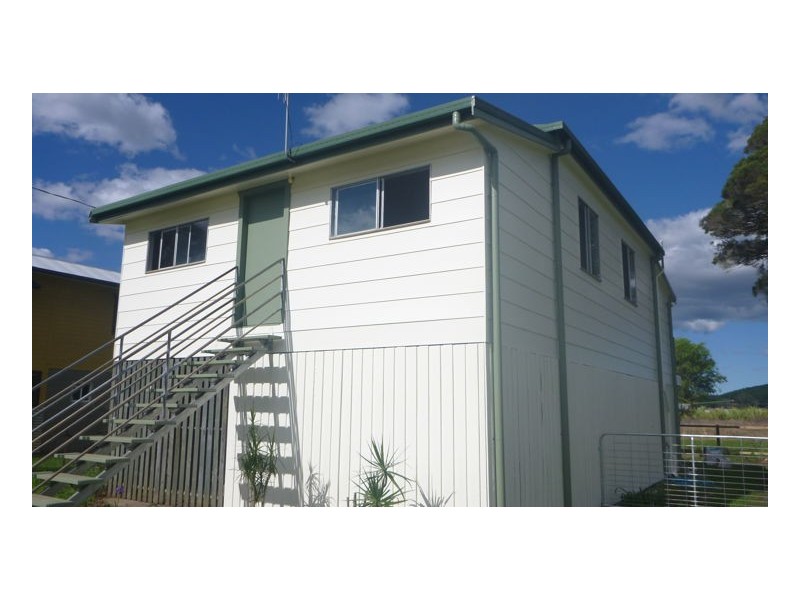
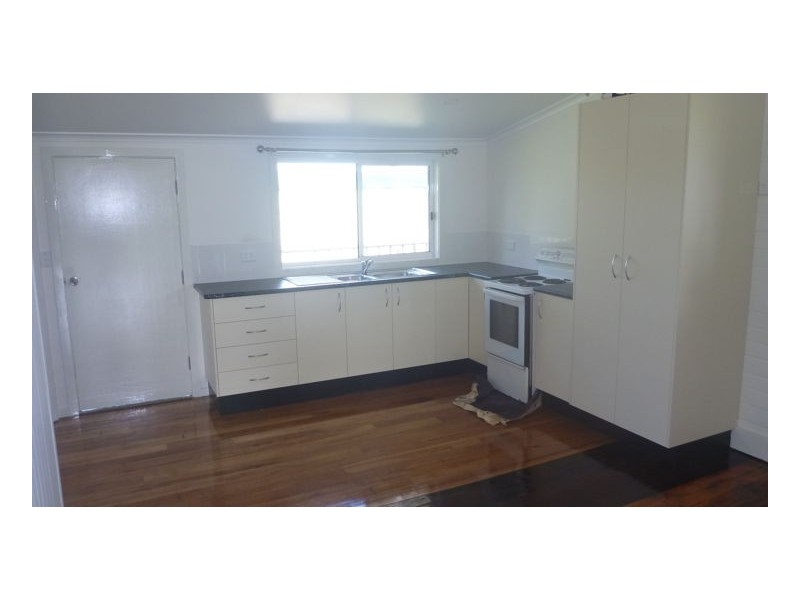
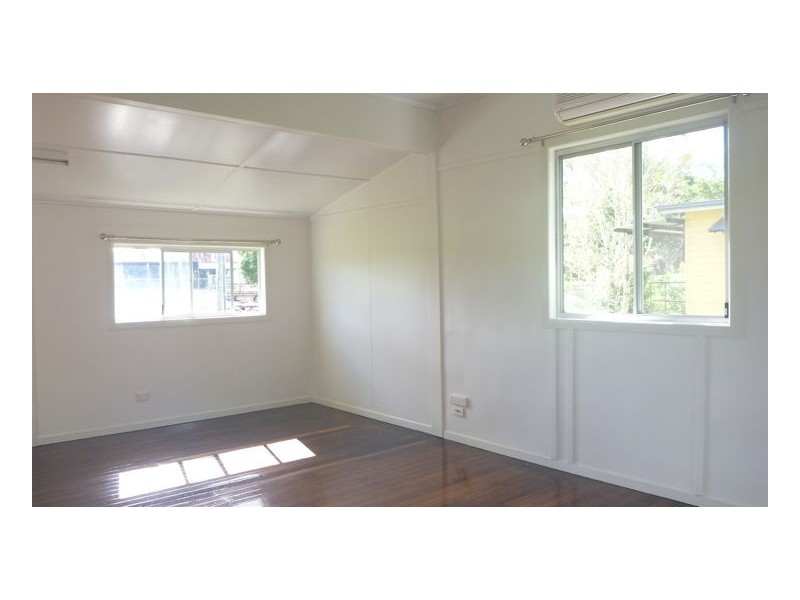
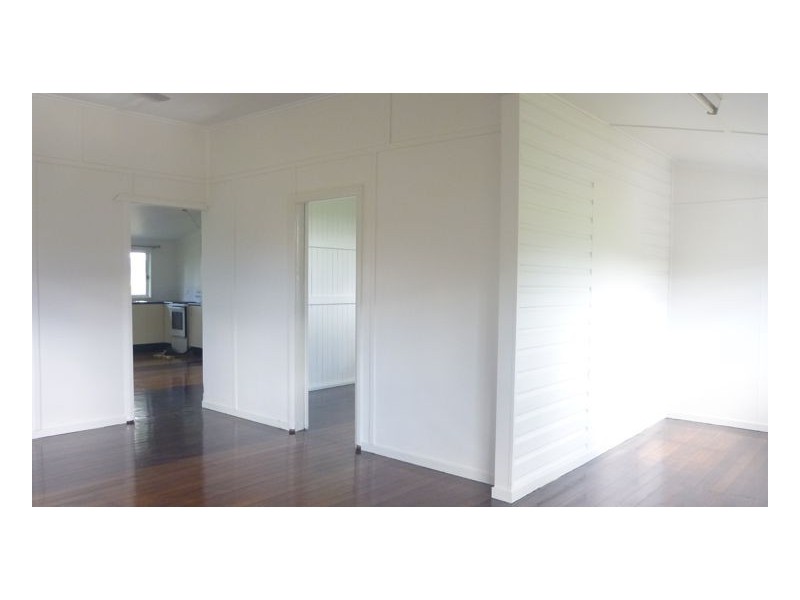
36 Railway Street,, Murwillumbah NSW 2484 Railway Street $330.00 per week. Listing history: 23 Sep, 2016 2 1 1 Listing ID: 32402388 Other properties to rent near 36 Railway Street,, Murwillumbah NSW 2484 38 Railway Street, South Murwillumbah NSW 2484 Location THIS PROPERTY WAS LEASED Enquiry about this property Name* Email* Phone* Message* Send me regular newsletters from Homehound Have agents get in touch about similar properties within the area What is 8 + 20?* Receive email alerts for properties like this Email alerts Email* Send me regular newsletters from Homehound. Have agents get in touch about similar properties within the area What is 8 + 20?*