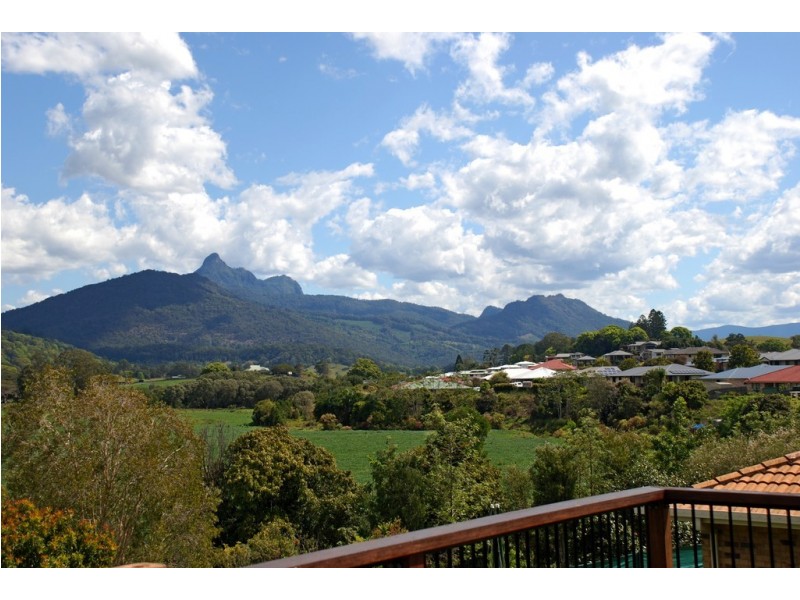
There are approximately 18,049 people living in Murwillumbah but… who are they?
44
49%
51%
Suburb Stats
$834/WK
$250/WK
$382/WK
Value of property in Murwillumbah and nearby suburbs
Murwillumbah
Junction Hill
Cabarita Beach
South Grafton
Average Home Price$479,070Average Rental Price$346Household Size2.5
Average Home Price$363,441Average Rental Price$345Household Size2.4
Average Home Price$532,487Average Rental Price$407Household Size2.5
Average Home Price$271,720Average Rental Price$291Household Size2.4
Water Useper year per person
0.6mln. litres
State Average 0.74 mln. litres
Nat. Average 0.74 mln. litres
Greenhouse Pollutionper year per person
16.48tonnes
State Average 19.31 tonnes
Nat. Average 20.3 tonnes
Dwelling Types
91%
5%
3%
Most Common Suburb Professions
17% Professio…
15% Technicia…
14% Managers…
12% Labourers…
Nearby schools: murwillumbah high school, murwillumbah south infants school, mt st patrick college, murwillumbah community college
Nearby cafes: cenzo cafe, the blue frog, sugar beat cafe, fish bowl cafe
Nearby doctors: kettle i h, rightfoot podiatry & footwear clinics, king street dental practice - dr. evans michael, king street medical centre-dr yabsley robyn
Nearby hospitals: queen street medical centre, king street medical centre, murwillumbah district hospital