Listing ID: 28442198
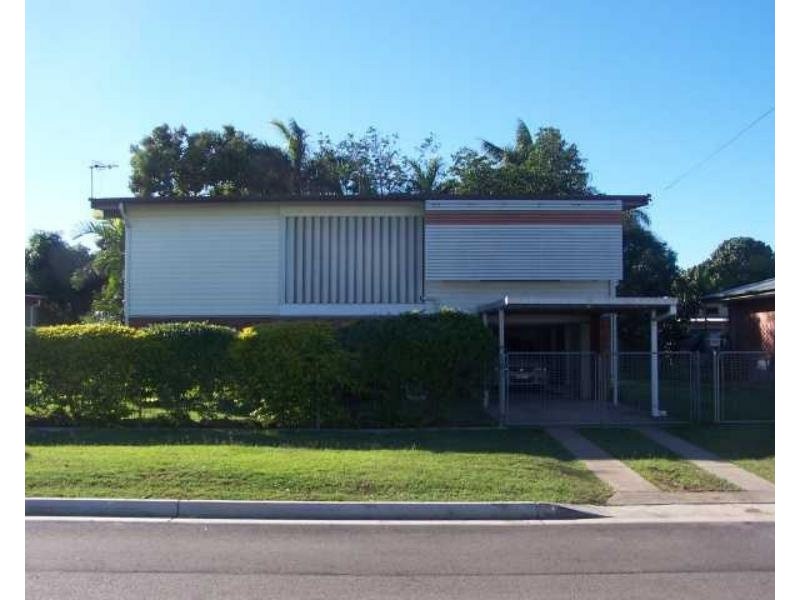
14 Quandong Street, Currajong QLD 4812
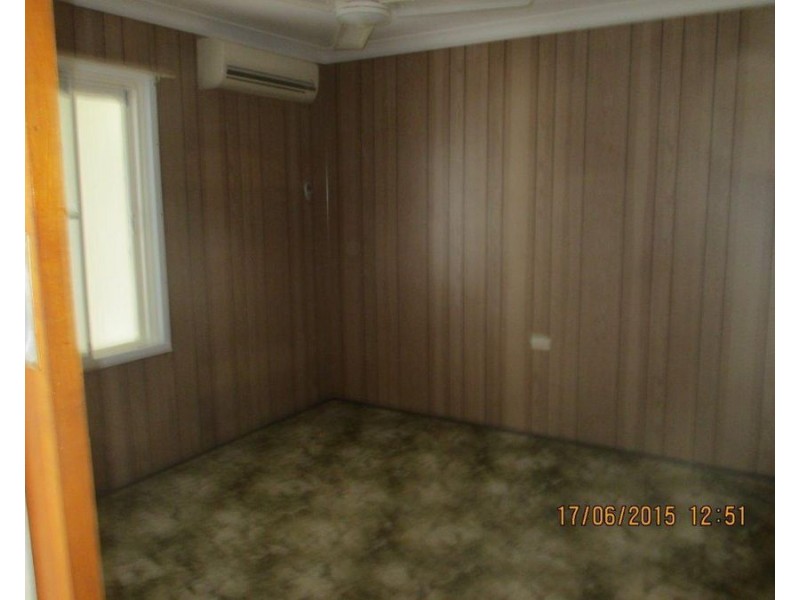
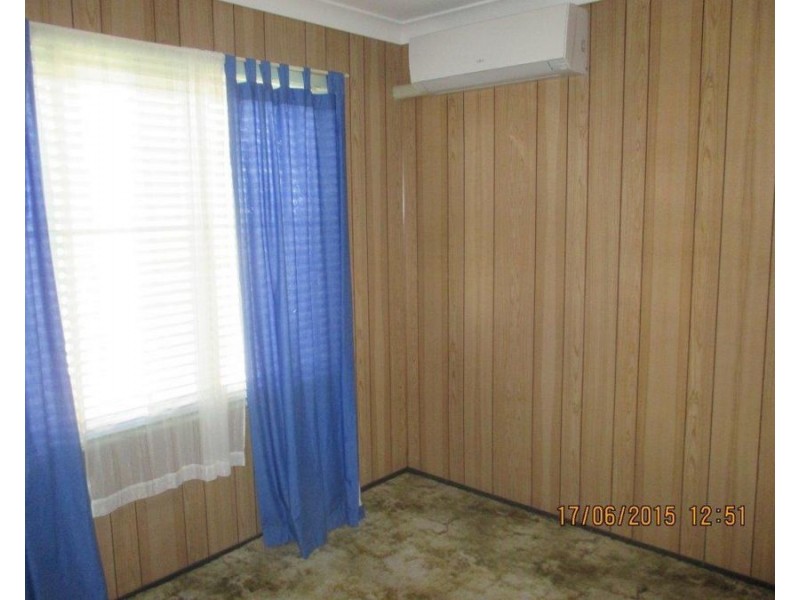
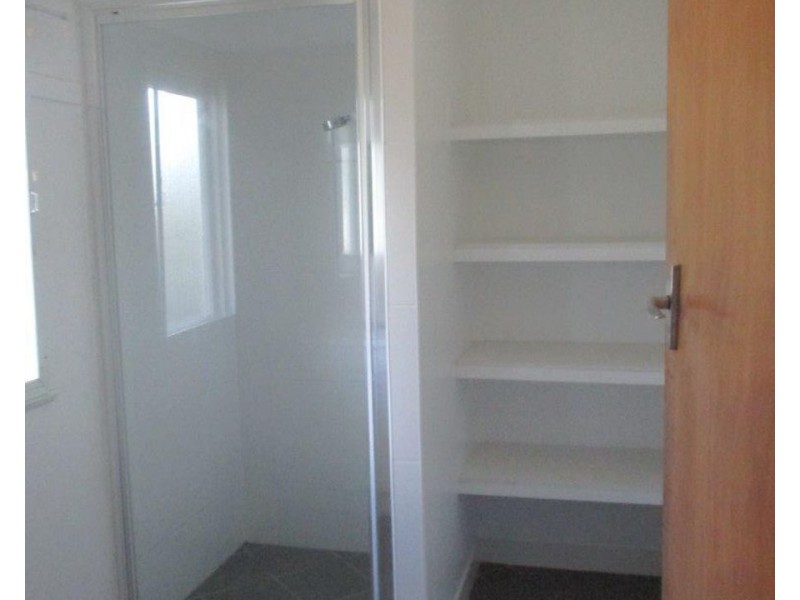
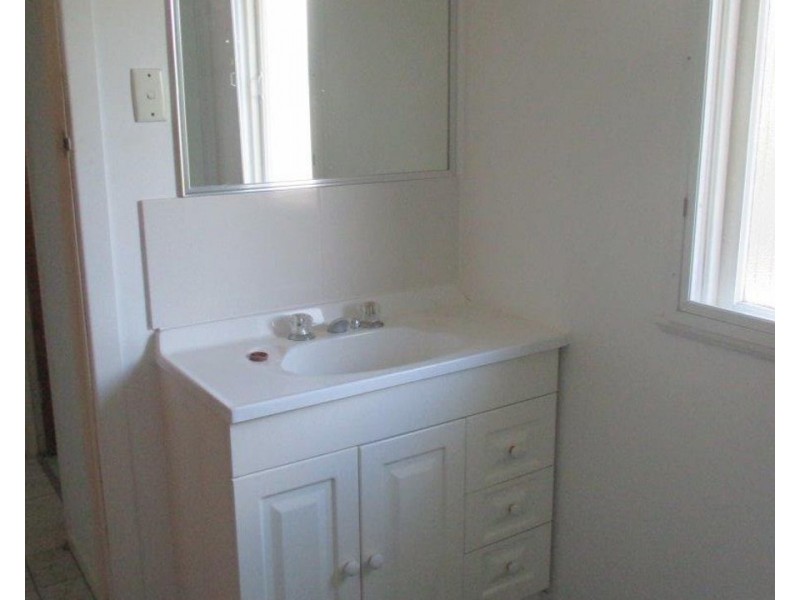
HIGHSET FAMILY HOME - CENTRAL TO EVERYTHING THAT MATTERS
$340 Per Week

- 3
- 1
- 2
HIGHSET FAMILY HOME - CENTRAL TO EVERYTHING THAT MATTERS


Listing ID: 28442198