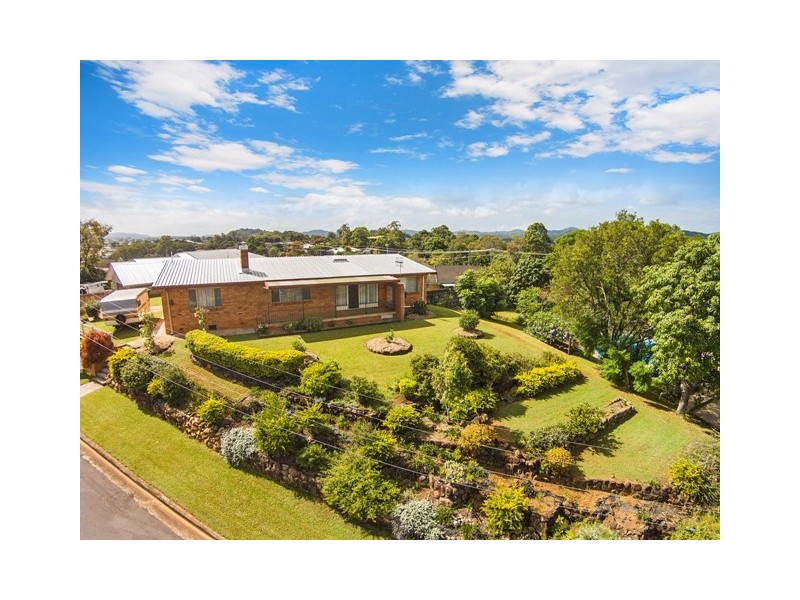
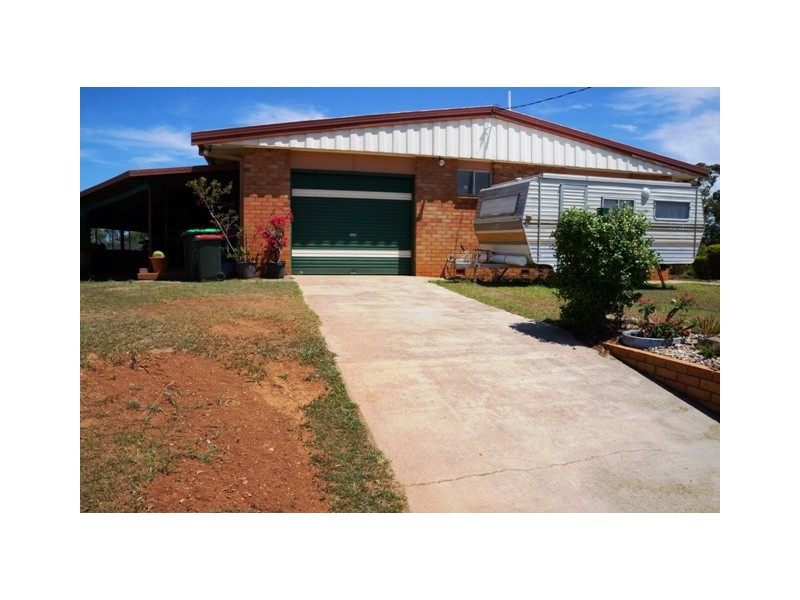
There are approximately 18,049 people living in Murwillumbah but… who are they?
44
49%
51%
Suburb Stats
$834/WK
$250/WK
$382/WK
Value of property in Murwillumbah and nearby suburbs
Murwillumbah
Ellangowan
Kyogle
James Creek
Average Home Price$479,070Average Rental Price$346Household Size2.5
Average Home Price$378,333Average Rental Price$273Household Size2.5
Average Home Price$359,884Average Rental Price$265Household Size2.4
Average Home Price$586,109Average Rental Price$8,252Household Size2.4
Water Useper year per person
0.6mln. litres
State Average 0.74 mln. litres
Nat. Average 0.74 mln. litres
Greenhouse Pollutionper year per person
16.48tonnes
State Average 19.31 tonnes
Nat. Average 20.3 tonnes
Dwelling Types
91%
5%
3%
Most Common Suburb Professions
17% Professio…
15% Technicia…
14% Managers…
12% Labourers…
Nearby schools: murwillumbah south infants school, murwillumbah east primary school, murwillumbah community college, mt st patrick college
Nearby cafes: cenzo cafe, fish bowl cafe, sugar beat cafe, king street cafe
Nearby doctors: king street medical centre-warne douglas, king street dental practice - dr. evans michael, king street medical centre-dr john moran, dr rafael maia
Nearby hospitals: murwillumbah district hospital, king street medical centre, queen street medical centre