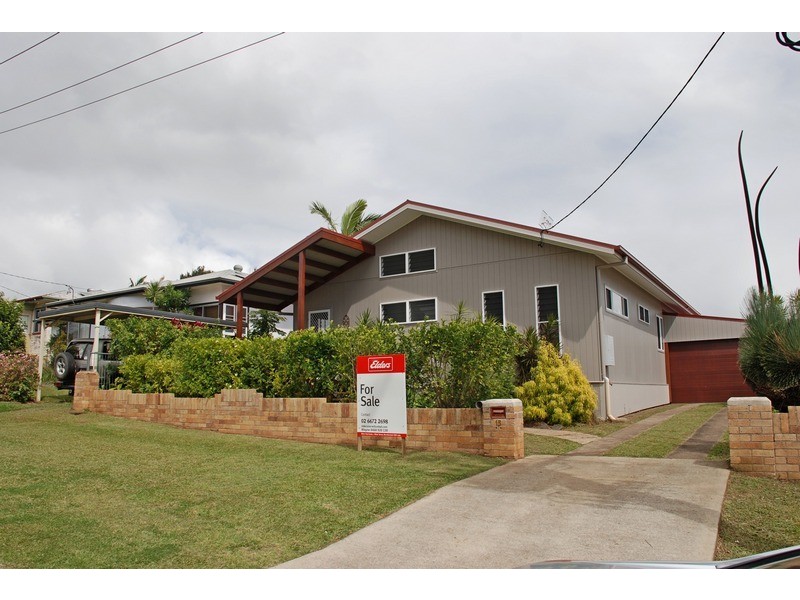
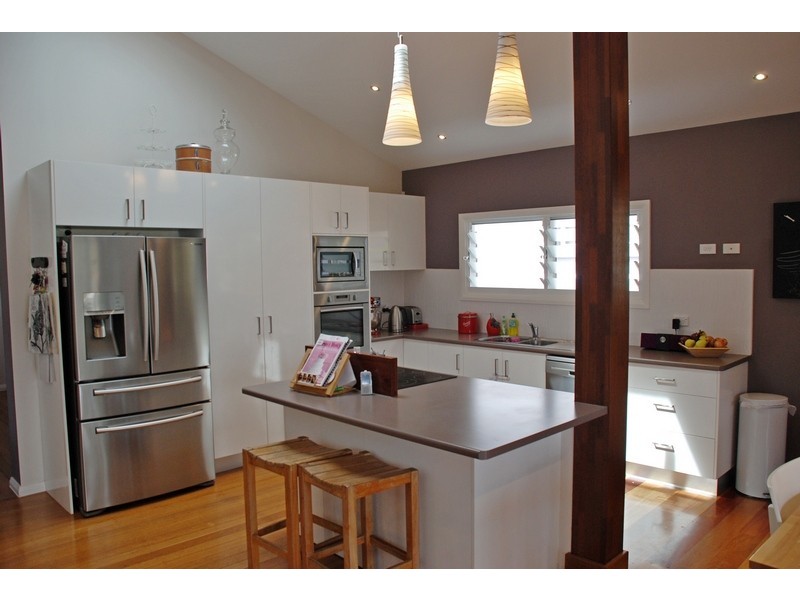
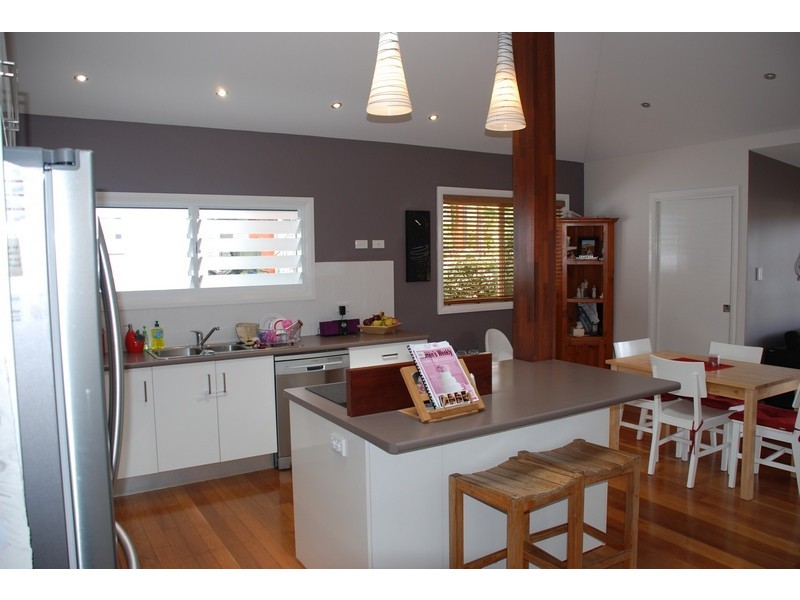
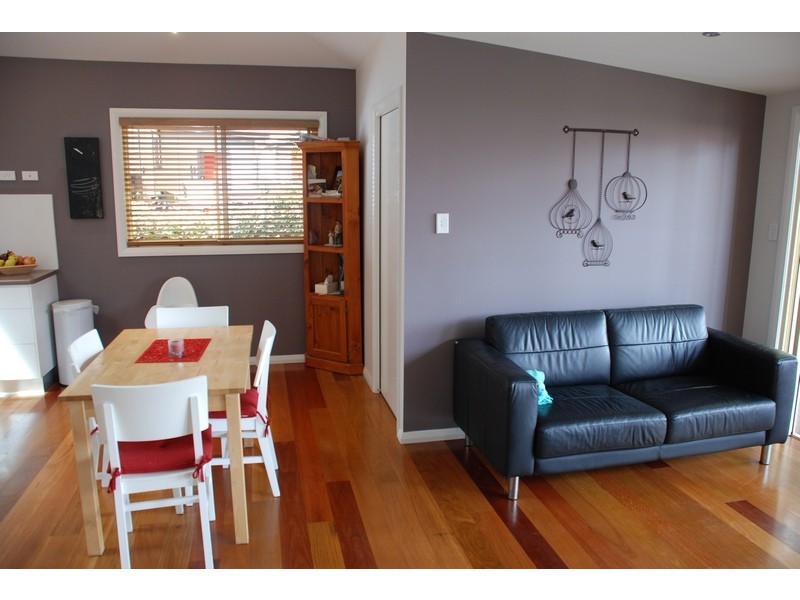
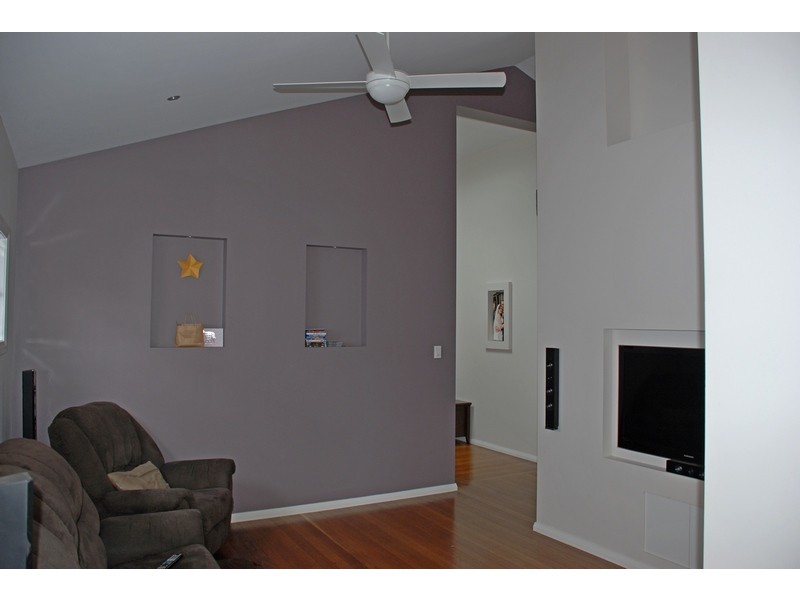
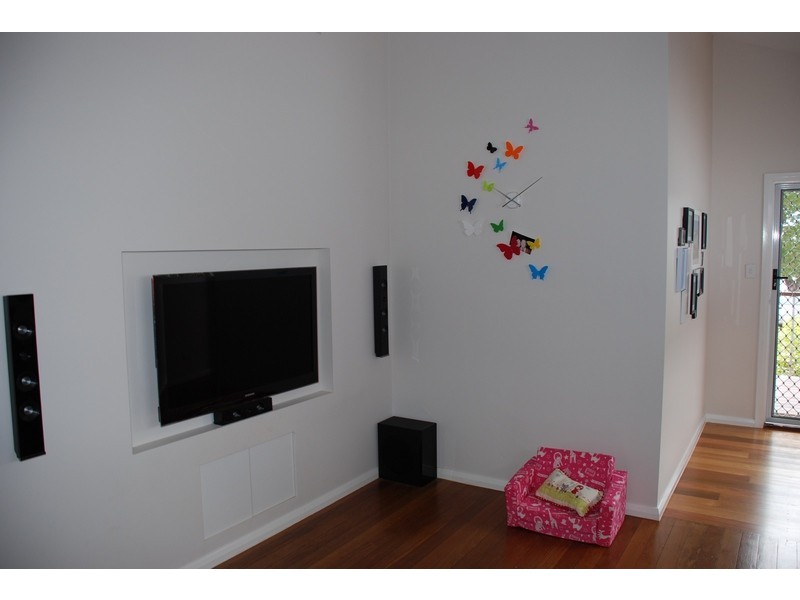
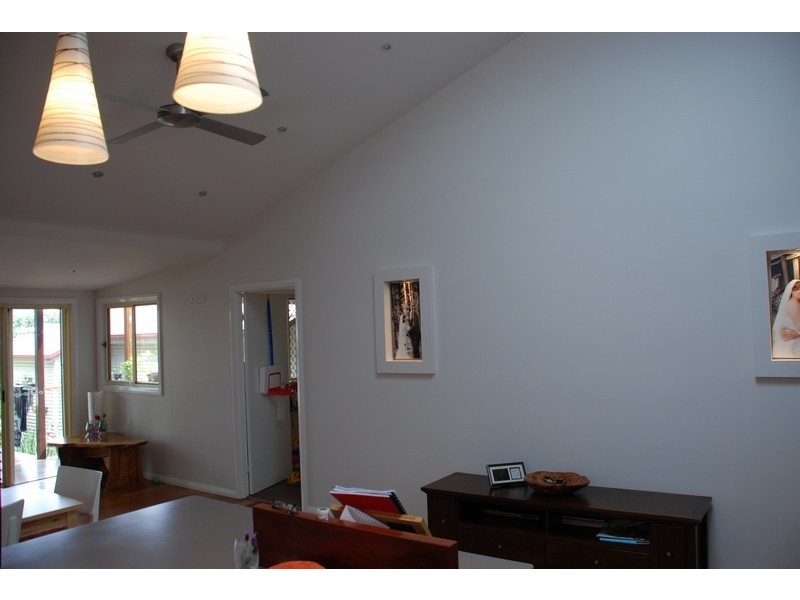
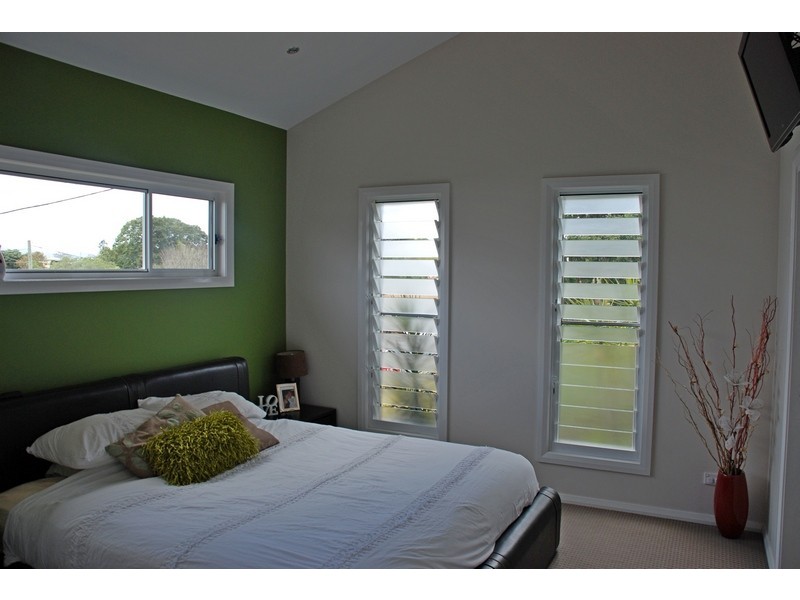
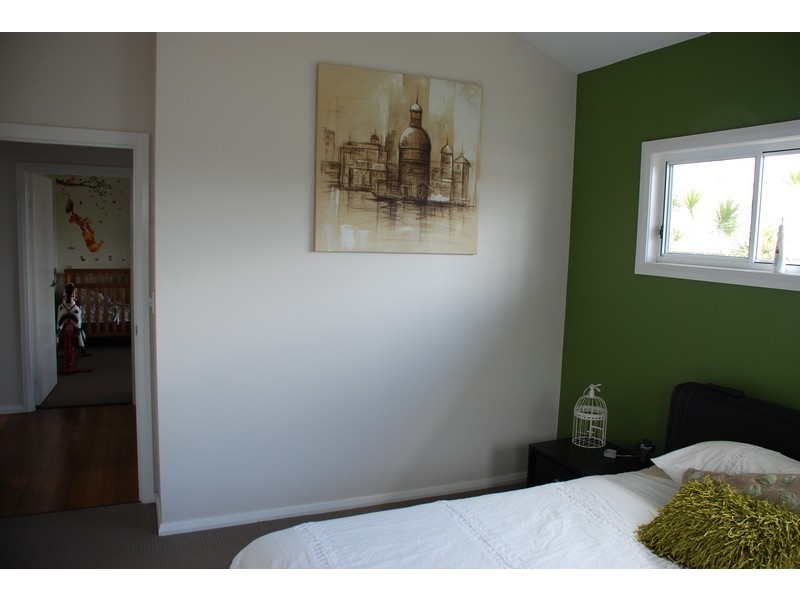
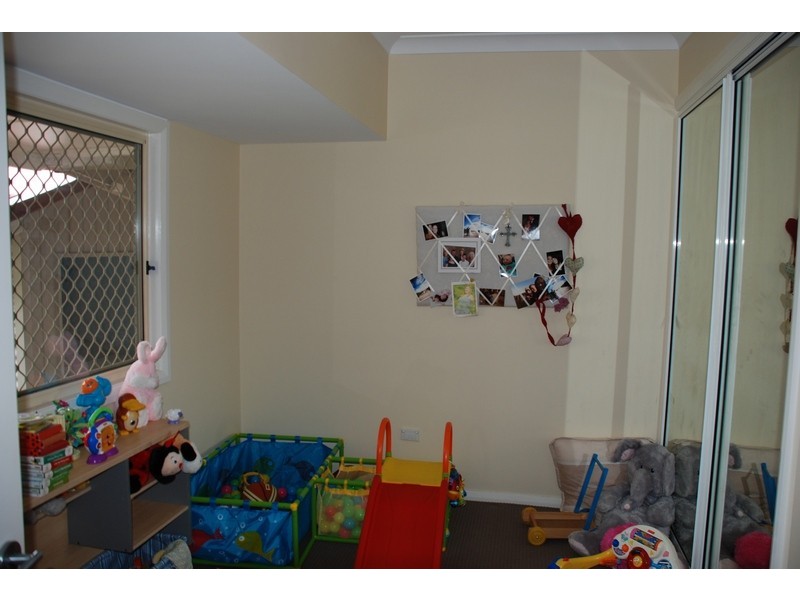
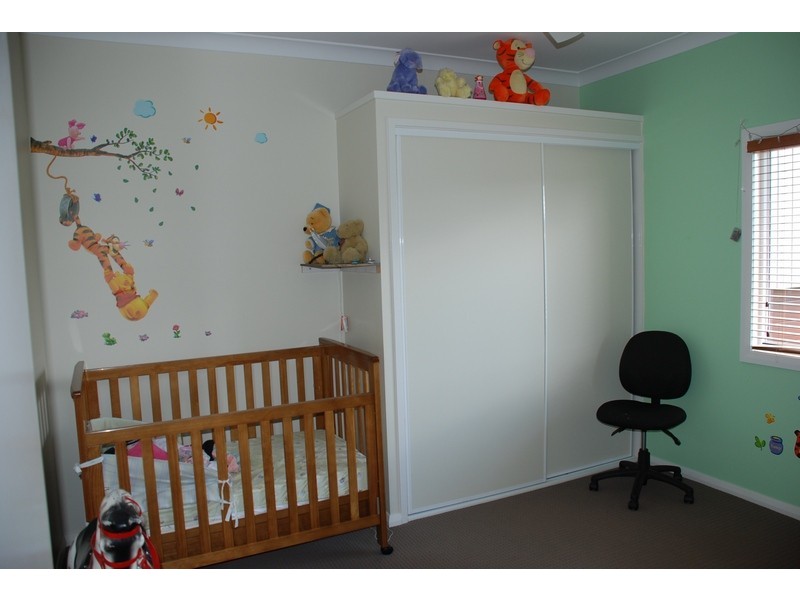
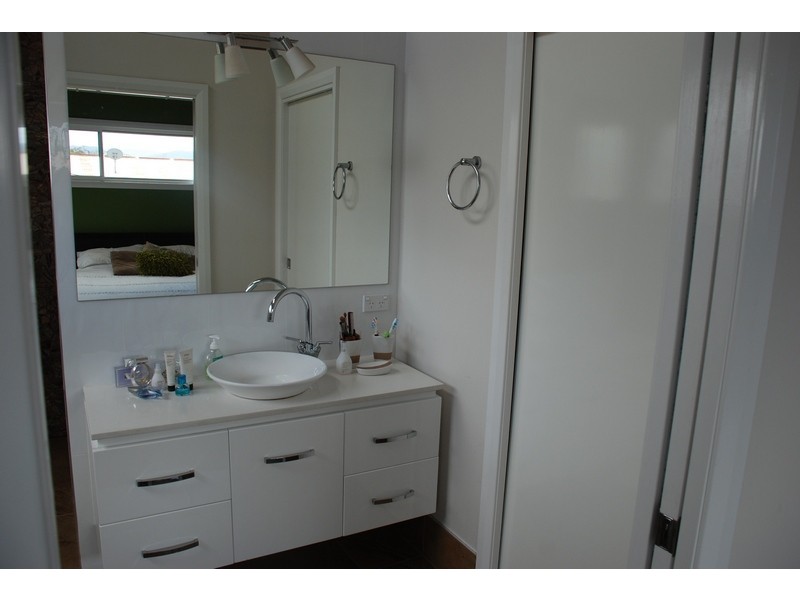
Murwillumbah NSW 2484 Beautifully Renovated Home in Quiet Street $435,000 3 2 2 Listing ID: 26777223 Other properties for sale near Murwillumbah NSW 2484 12 Charles Street, Murwillumbah NSW 2484 4-6 Frangela Drive, Murwillumbah NSW 2484 4-6 Frangela Drive, Murwillumbah NSW 2484 11 William Street, Murwillumbah NSW 2484 5 Tulipwood Court, Murwillumbah NSW 2484 Location THIS PROPERTY WAS SOLD Enquiry about this property Name* Email* Phone* Message* Send me regular newsletters from Homehound Have agents get in touch about similar properties within the area What is 8 + 20?* Receive email alerts for properties like this Email alerts Email* Send me regular newsletters from Homehound. Have agents get in touch about similar properties within the area What is 8 + 20?*