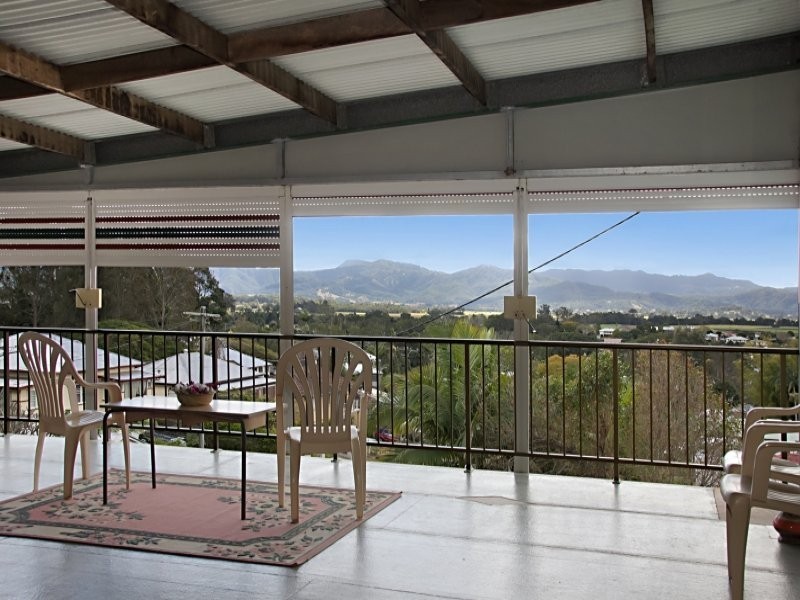
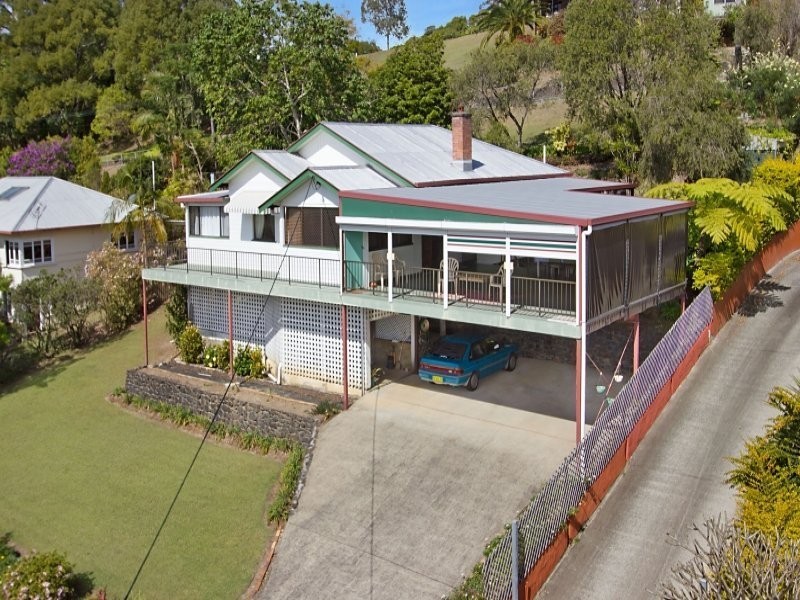
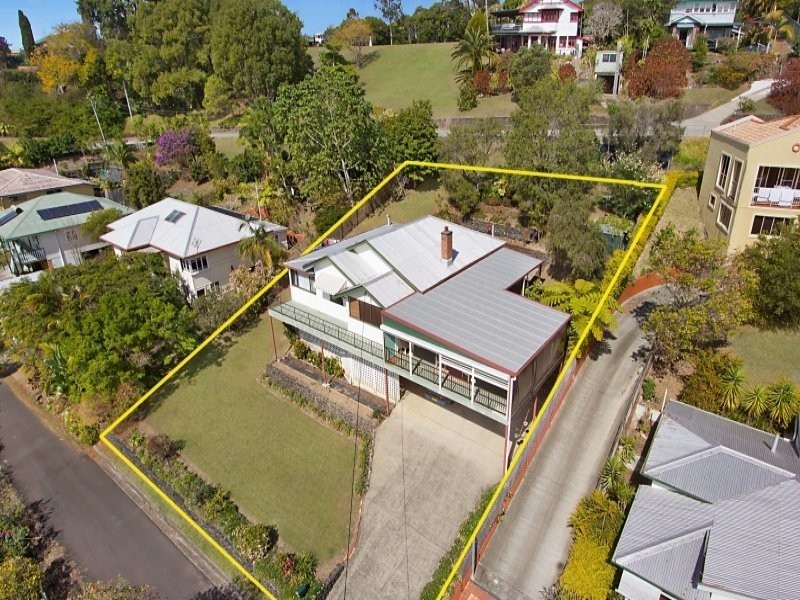
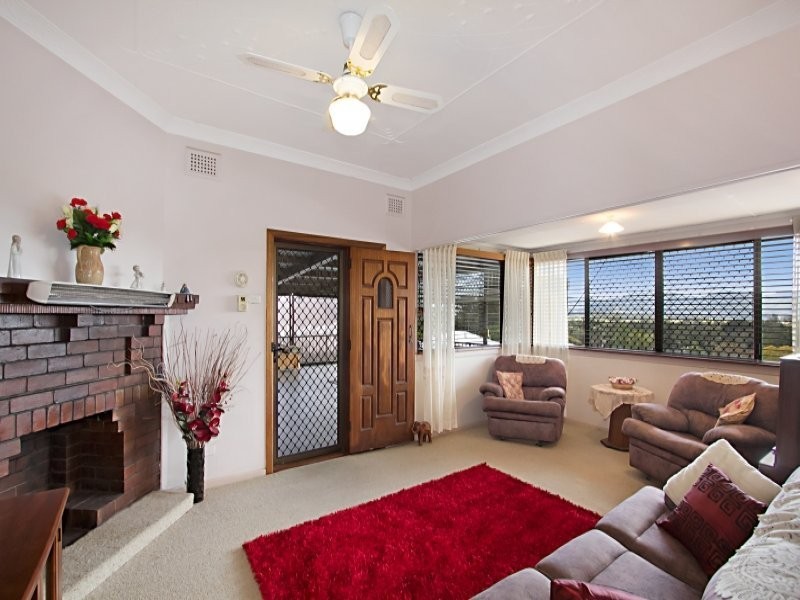
14 Spring Lane, Murwillumbah NSW 2484 It's all about the view! Offers Above $349,000 Listing history: 15 Aug, 2014 3 2 3 Listing ID: 26423128 Other properties for sale near 14 Spring Lane, Murwillumbah NSW 2484 18 Spring lane, Murwillumbah NSW 2484 4 SPRING LANE, Murwillumbah NSW 2484 Location THIS PROPERTY WAS WITHDRAWN Enquiry about this property Name* Email* Phone* Message* Send me regular newsletters from Homehound Have agents get in touch about similar properties within the area What is 8 + 20?* Receive email alerts for properties like this Email alerts Email* Send me regular newsletters from Homehound. Have agents get in touch about similar properties within the area What is 8 + 20?*