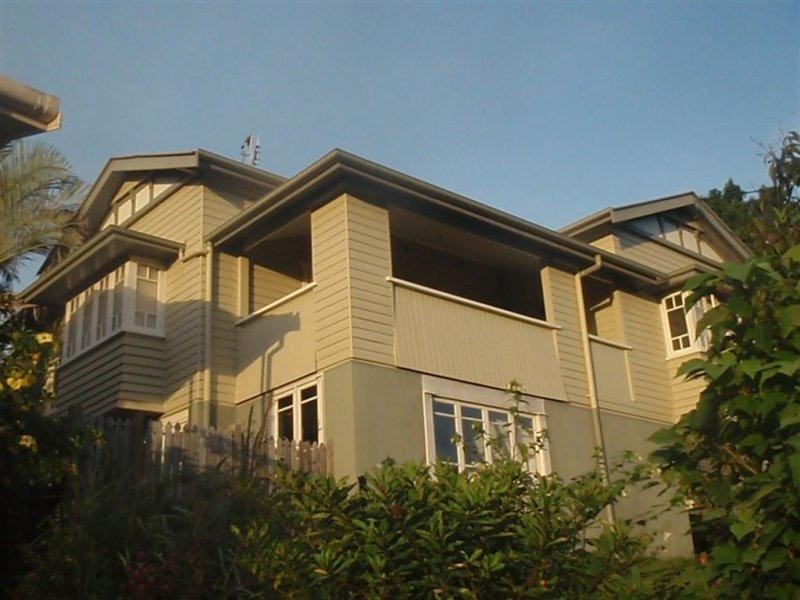
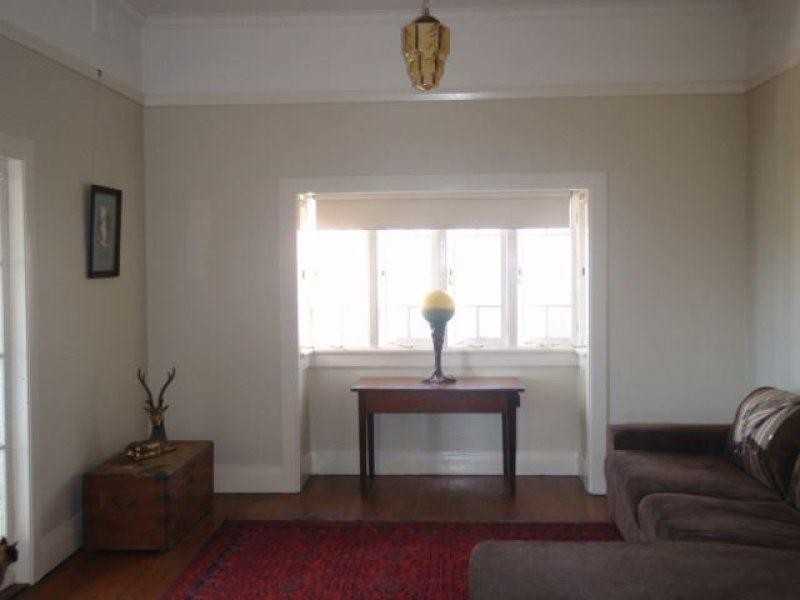
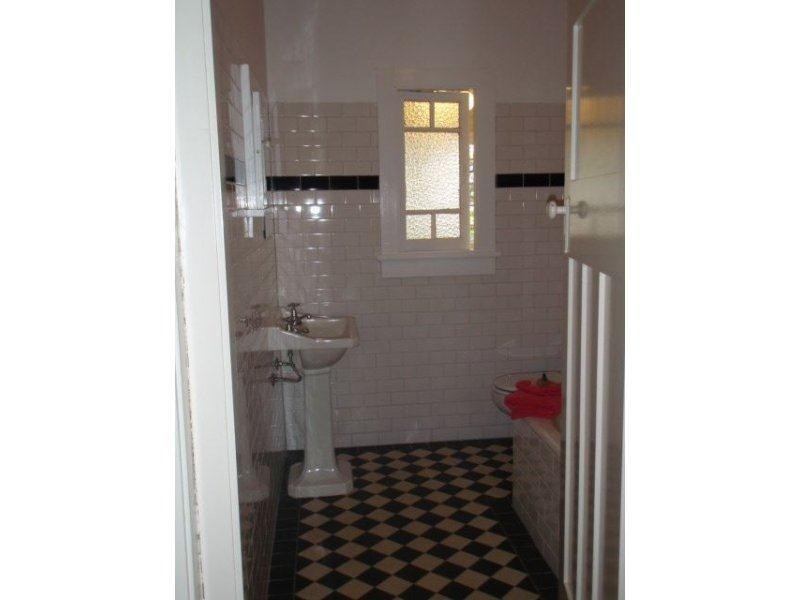
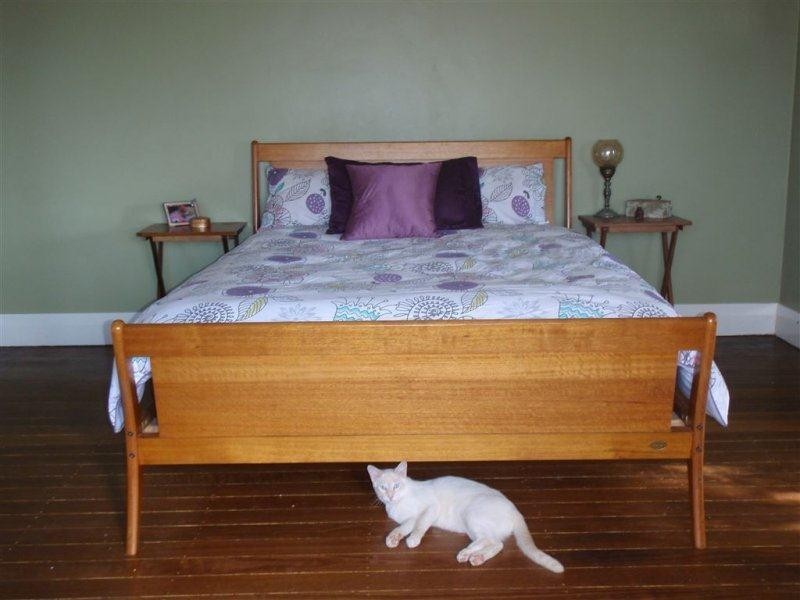
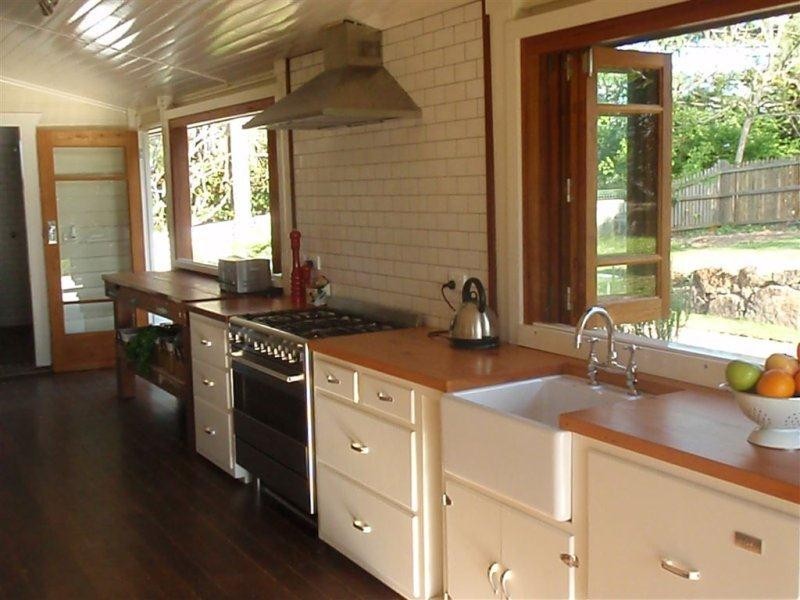
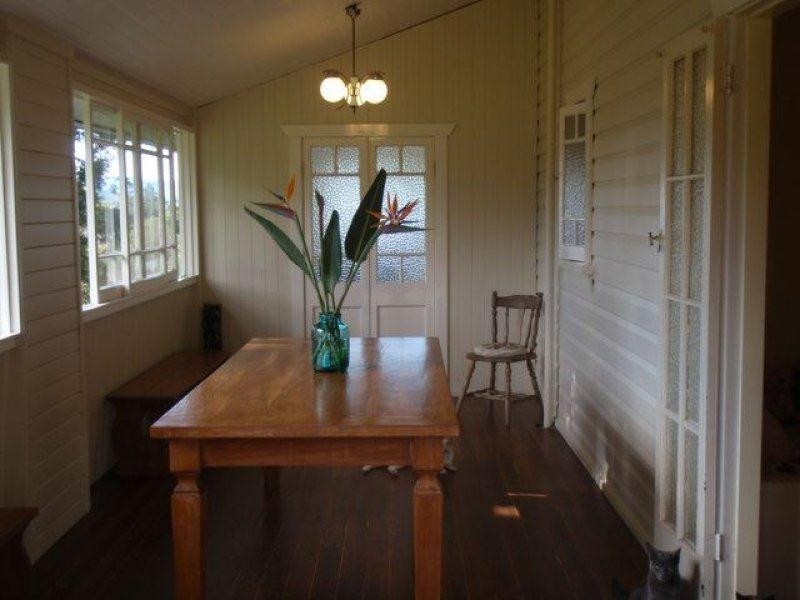
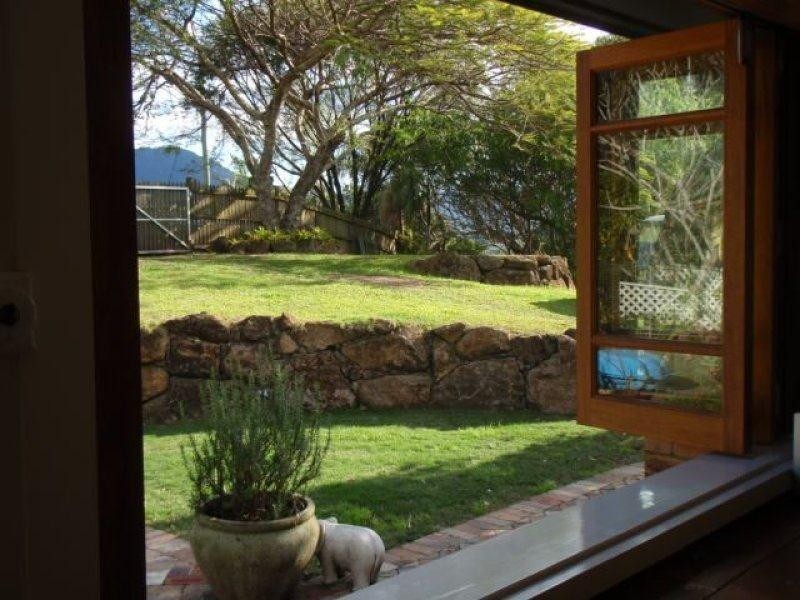
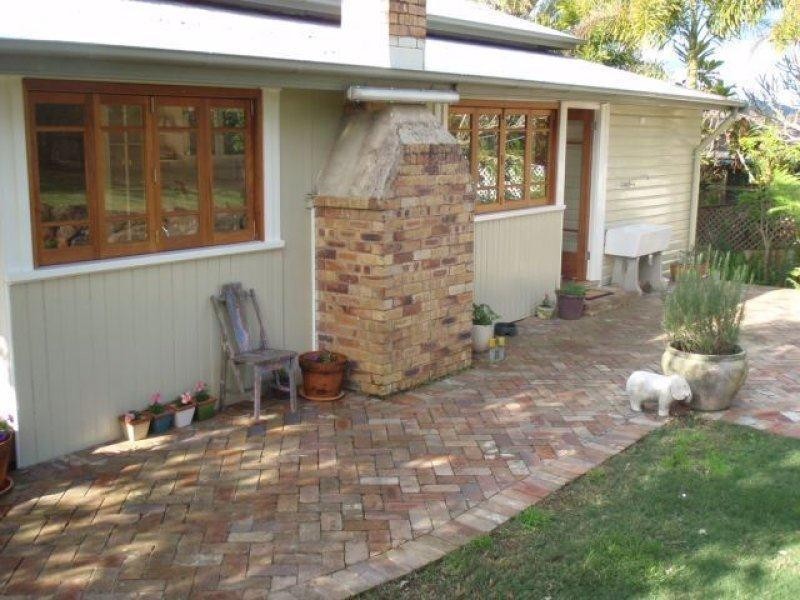
There are approximately 18,049 people living in Murwillumbah but… who are they?
44
49%
51%
Suburb Stats
$834/WK
$250/WK
$382/WK
Value of property in Murwillumbah and nearby suburbs
Murwillumbah
Boat Harbour
Brushgrove
Suffolk Park
Average Home Price$479,070Average Rental Price$346Household Size2.5
Average Home Price$687,806Average Rental Price$536Household Size2.6
Average Home Price$460,239Average Rental Price$327Household Size2.4
Average Home Price$937,592Average Rental Price$692Household Size2.3
Water Useper year per person
0.6mln. litres
State Average 0.74 mln. litres
Nat. Average 0.74 mln. litres
Greenhouse Pollutionper year per person
16.48tonnes
State Average 19.31 tonnes
Nat. Average 20.3 tonnes
Dwelling Types
91%
5%
3%
Most Common Suburb Professions
17% Professio…
15% Technicia…
14% Managers…
12% Labourers…
Nearby schools: murwillumbah community college, murwillumbah east primary school, murwillumbah south infants school, mt st patrick college
Nearby cafes: sugar beat cafe, king street cafe, the modern grocer, cenzo cafe
Nearby doctors: advanced radiology clinics murwillumbah, main street medical centre, king street dental practice - dr. evans michael, rightfoot podiatry & footwear clinics
Nearby hospitals: king street medical centre, murwillumbah district hospital, queen street medical centre