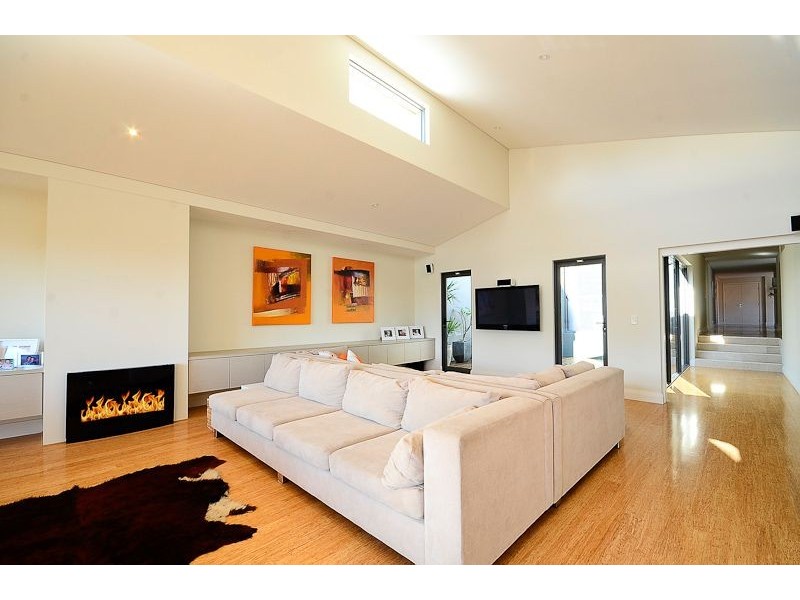
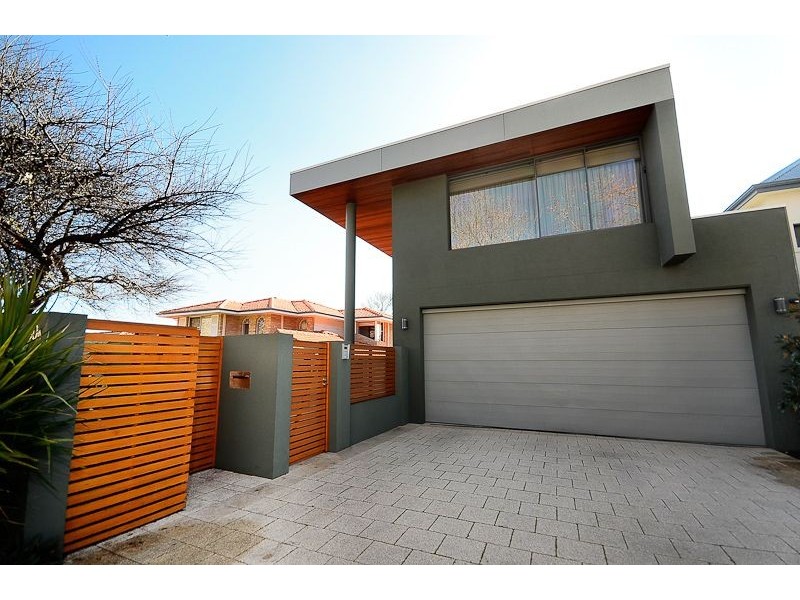
There are approximately 19,033 people living in Applecross but… who are they?
41
48%
52%
Suburb Stats
$1832/WK
$380/WK
$617/WK
Value of property in Applecross and nearby suburbs
Applecross
Success
Murdoch
Darling Downs
Average Home Price$1,425,409Average Rental Price$526Household Size2.5
Average Home Price$522,935Average Rental Price$426Household Size2.9
Average Home Price$724,214Average Rental Price$371Household Size3
Average Home Price$653,286Average Rental Price$447Household Size3
Water Useper year per person
0.83mln. litres
State Average 0.72 mln. litres
Nat. Average 0.74 mln. litres
Greenhouse Pollutionper year per person
19.99tonnes
State Average 18 tonnes
Nat. Average 20.3 tonnes
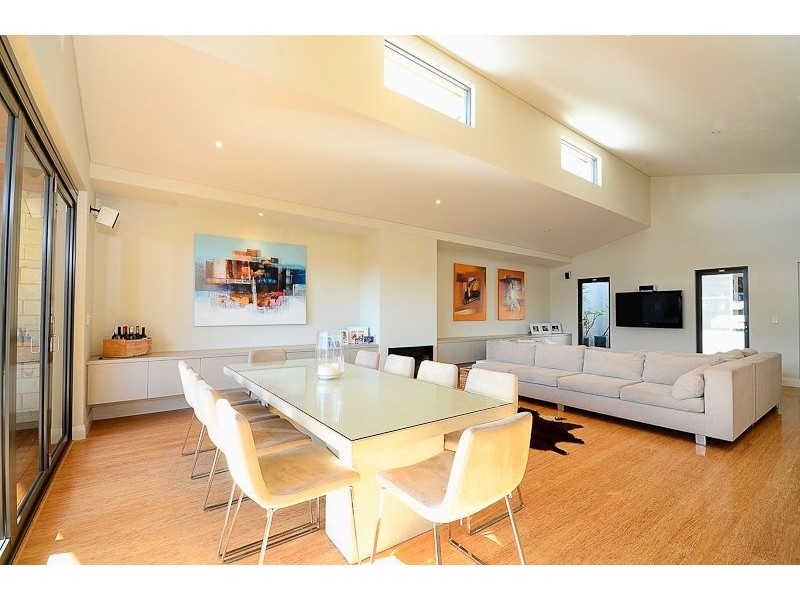
Dwelling Types
92%
8%
0%
Most Common Suburb Professions
34% Professio…
18% Managers…
16% Clerical…
9% Technicia…
Nearby shopping: handmade children's markets, colette by colette hayman
Nearby schools: applecross early childhood centre, australian school of natural beauty & spa therapies, applecross primary school, ardross primary school
Nearby cafes: miss maud garden city, the bridge cafe, jesters store - applecross, muffin break
Nearby doctors: applecross dental surgery, anthony lane & dom longo, ardross dental centre, applecross podiatry
Nearby hospitals: marian medicals, reynolds road 7 day medical centre, queens road surgery, queens road surgery