Listing ID: 32879263
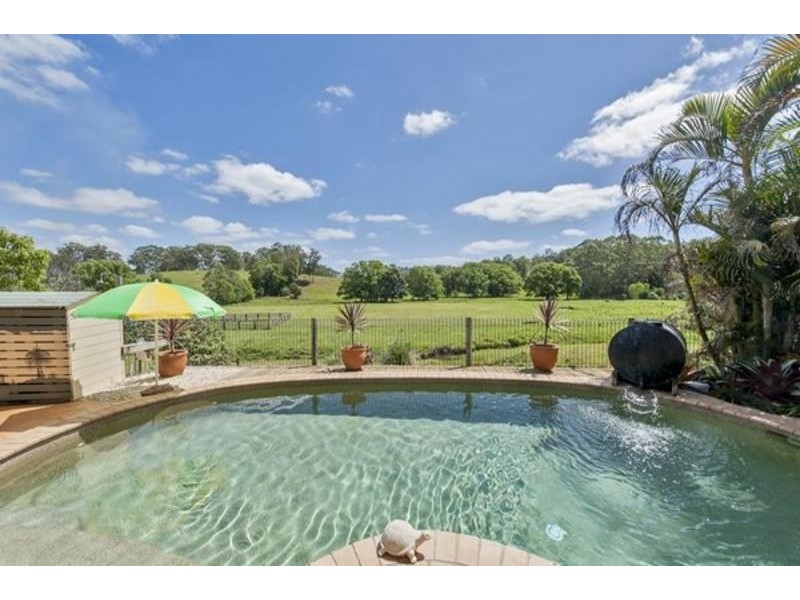
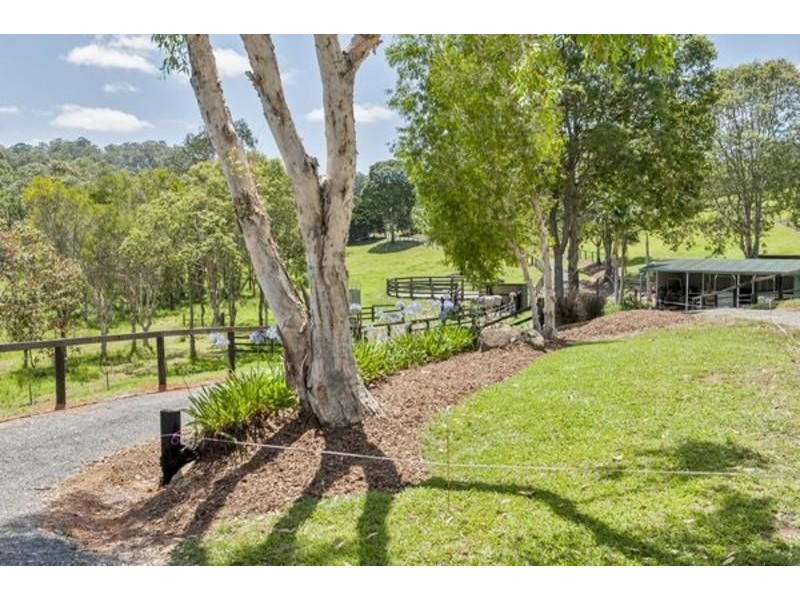
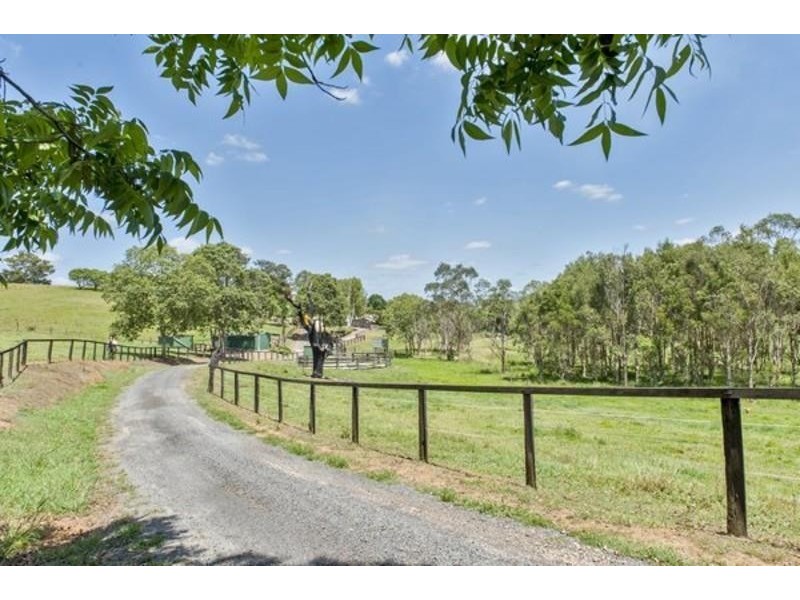
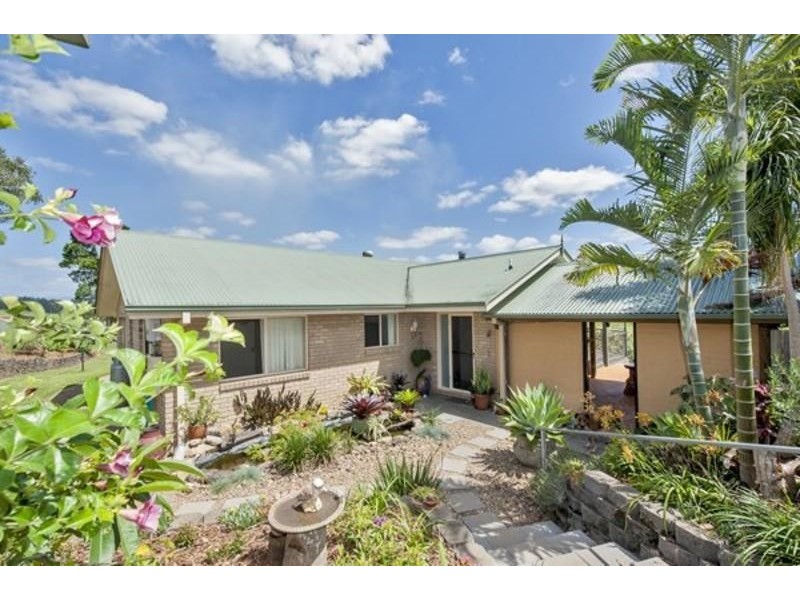
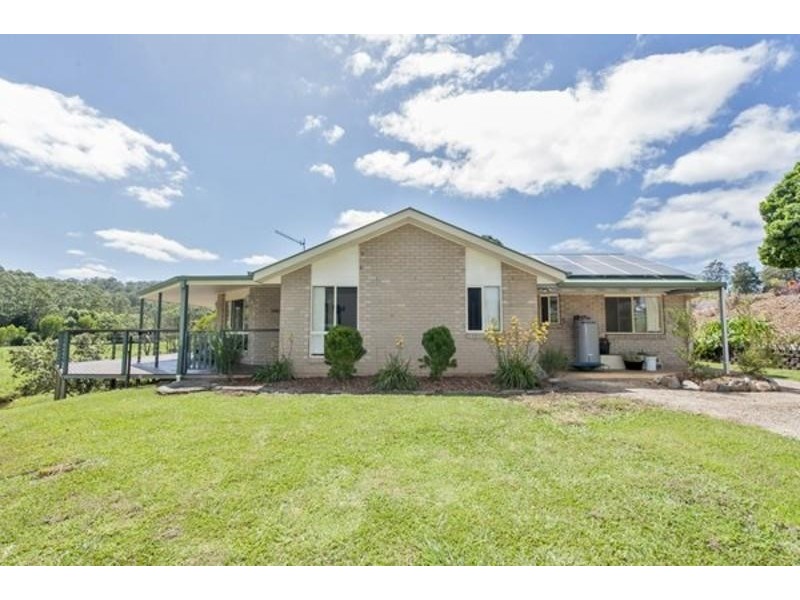
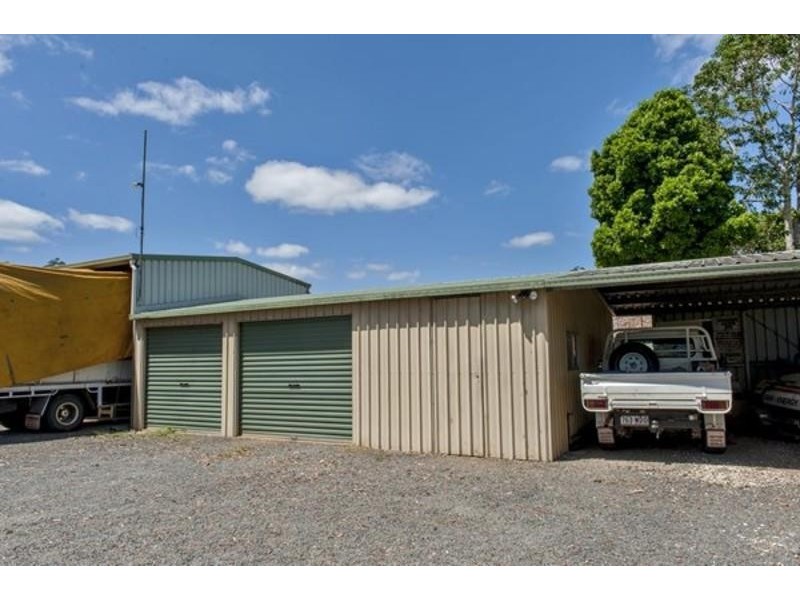
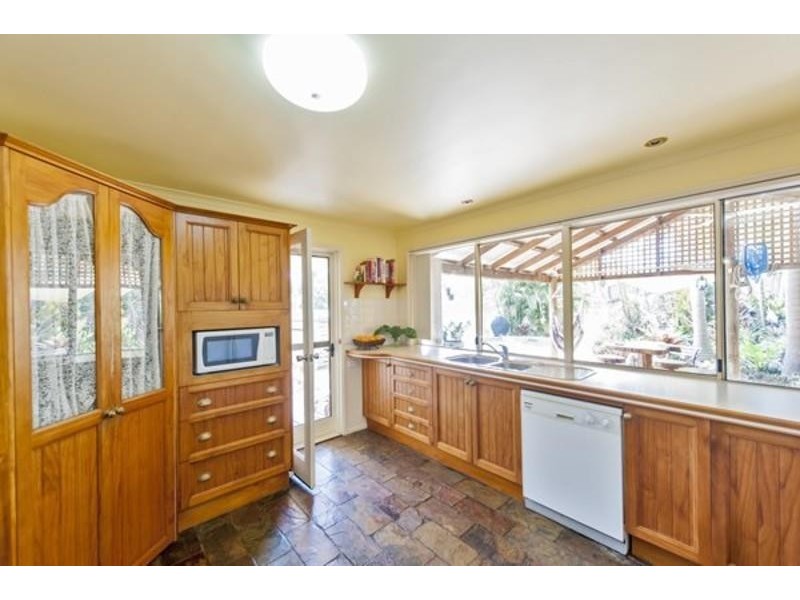
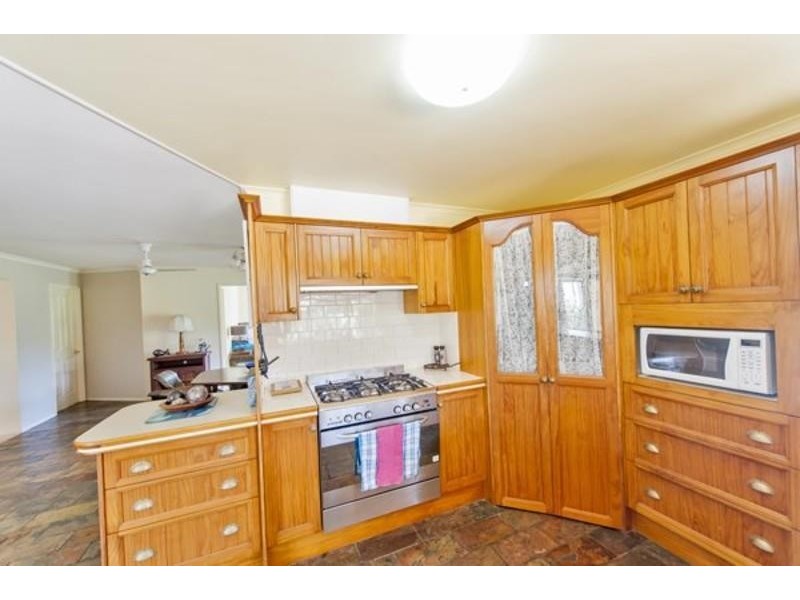
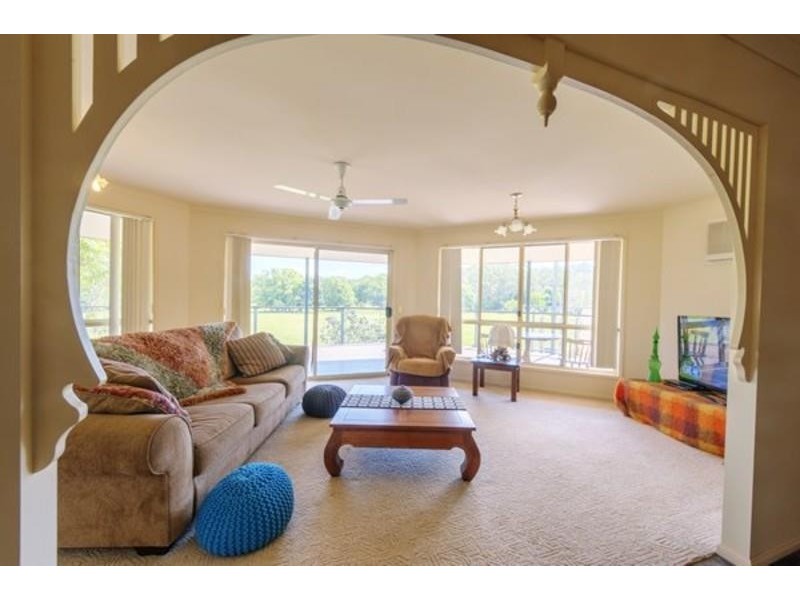
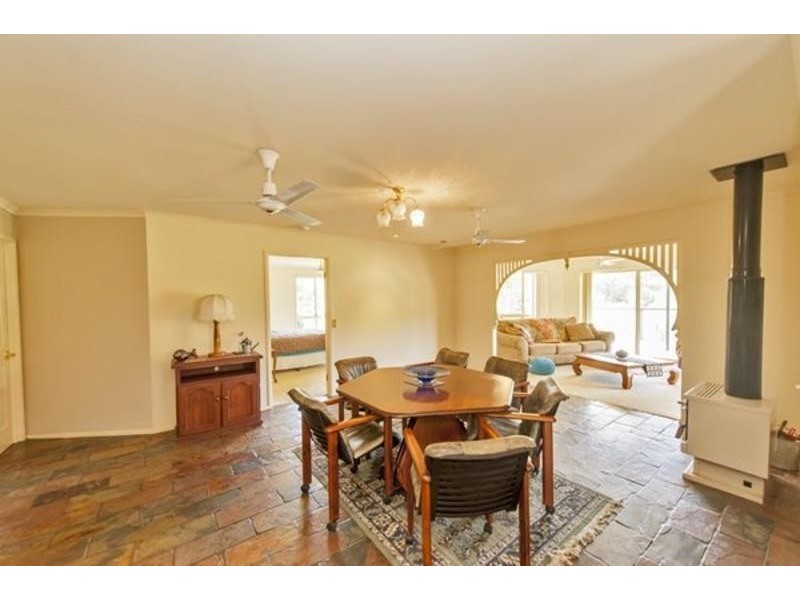
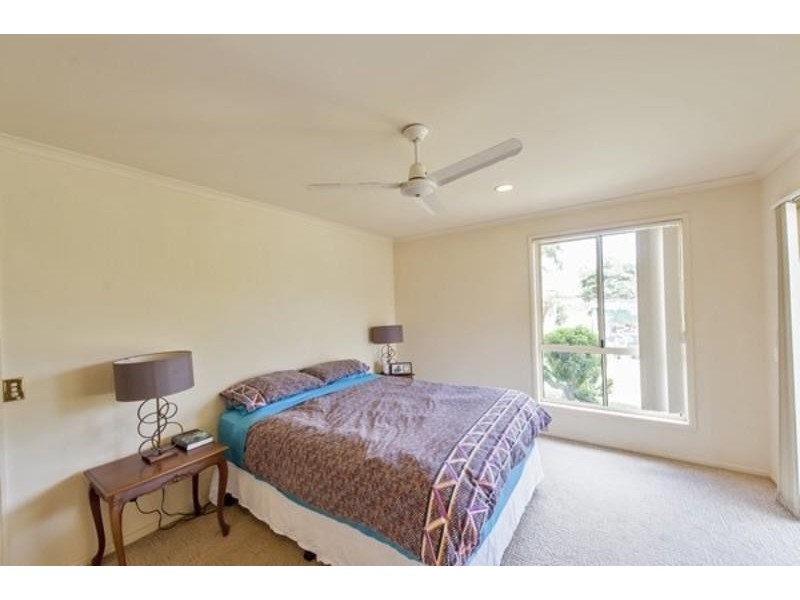
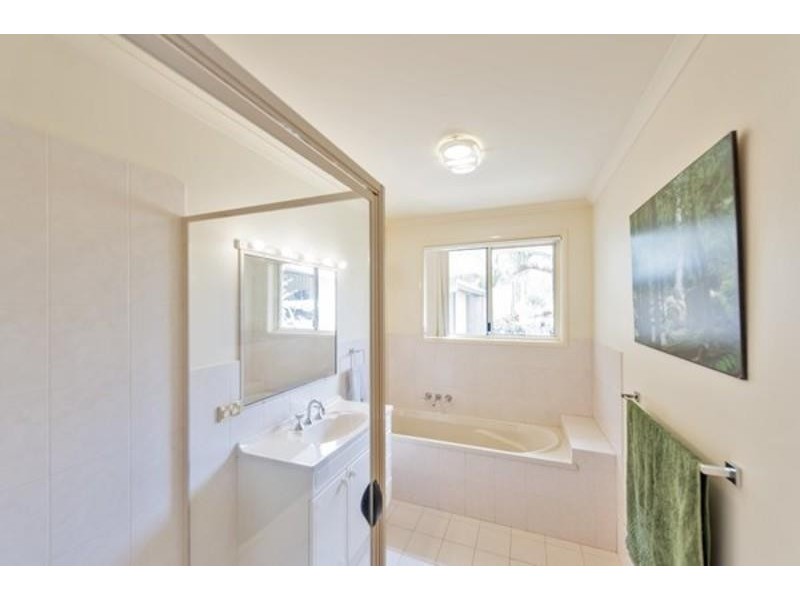
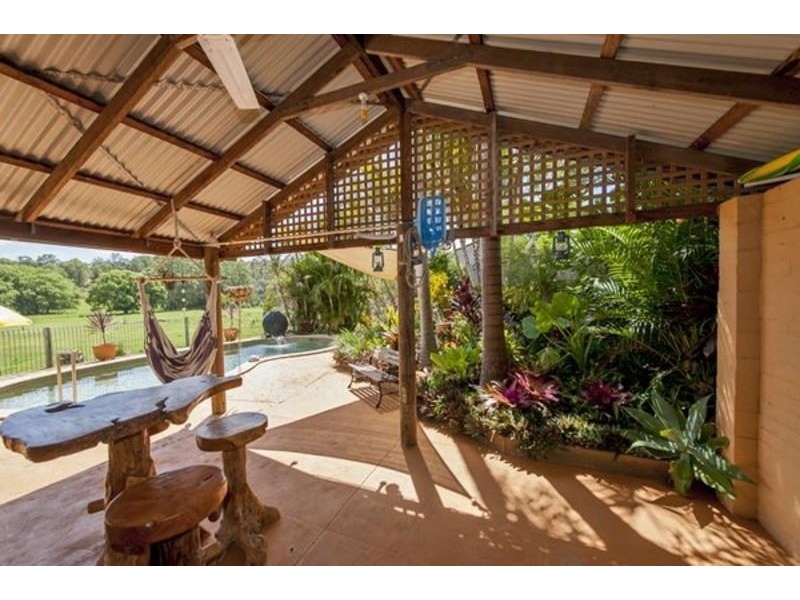
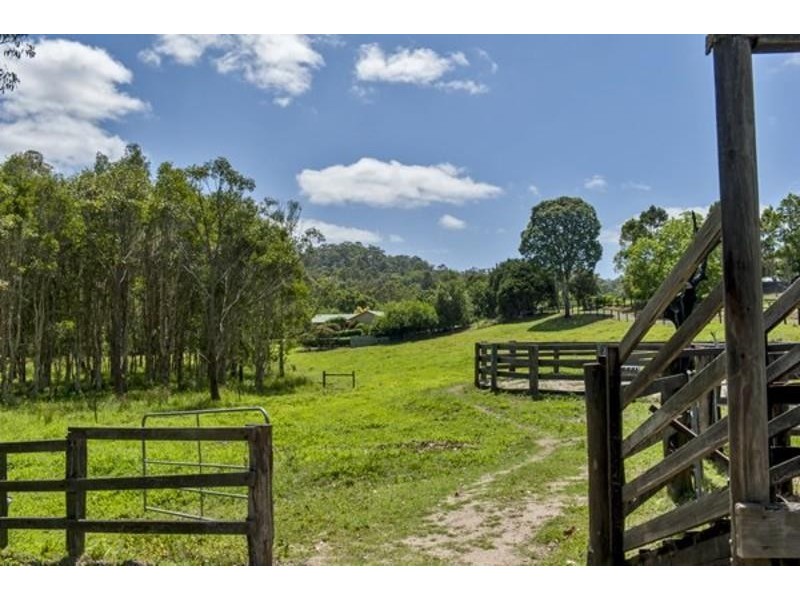
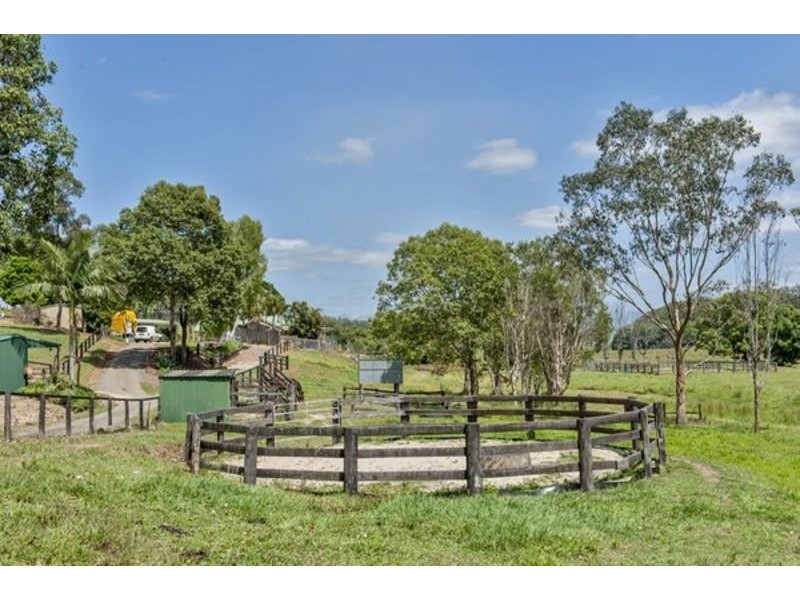
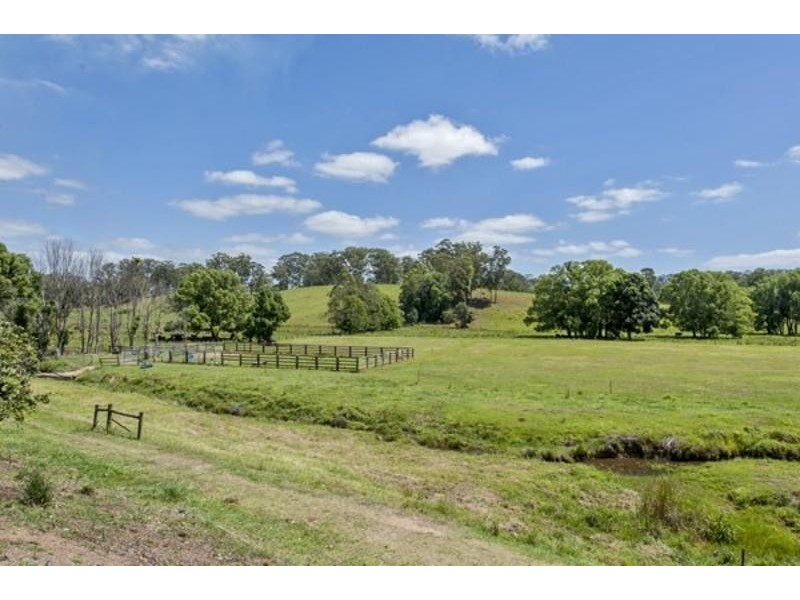
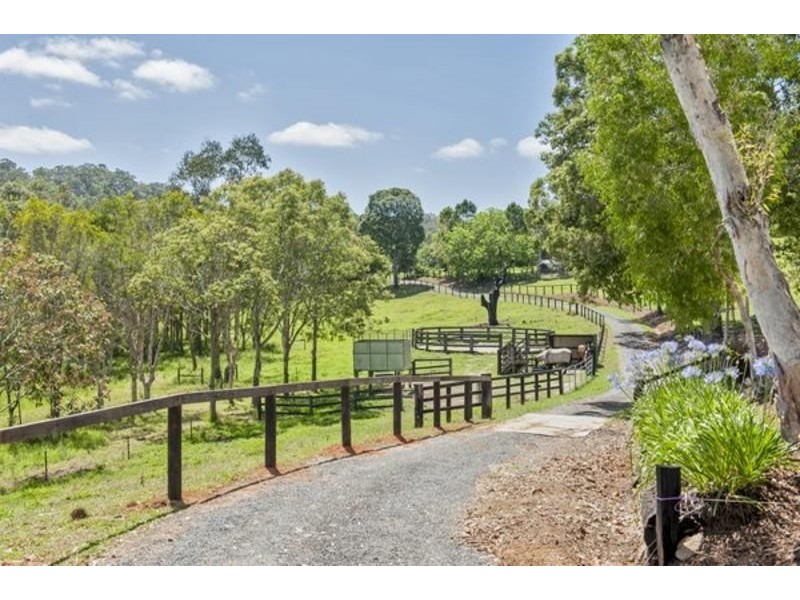
440 Wardrop Valley Road, Murwillumbah NSW 2484
SELLERS BOUGHT ELSEWHERE - MUST SELL
Pre-Auction
- Listing history:
- 22 Nov, 2016

- 3
- 2
- 8
SELLERS BOUGHT ELSEWHERE - MUST SELL


Listing ID: 32879263