Listing ID: 34992823
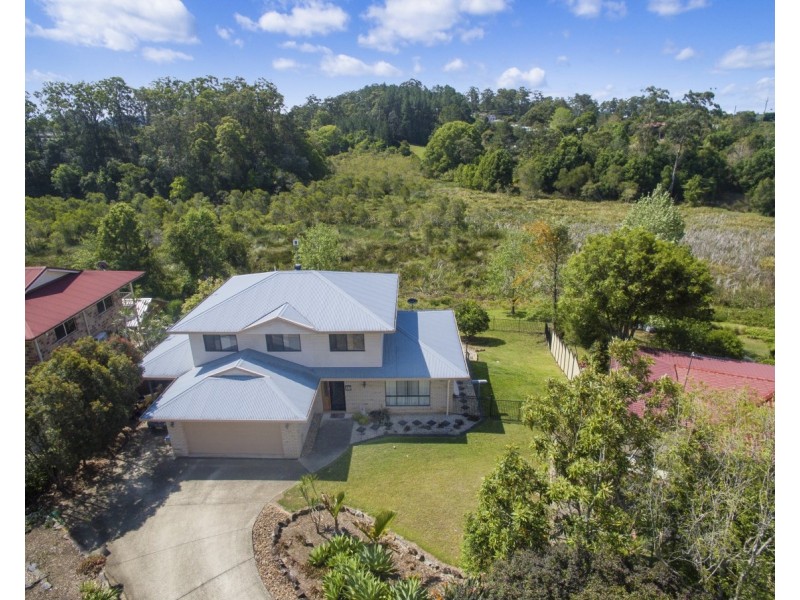
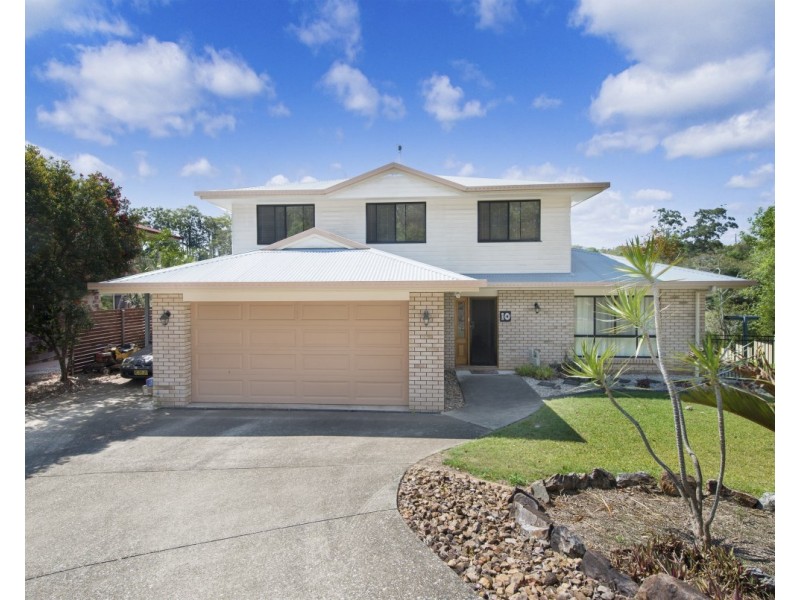
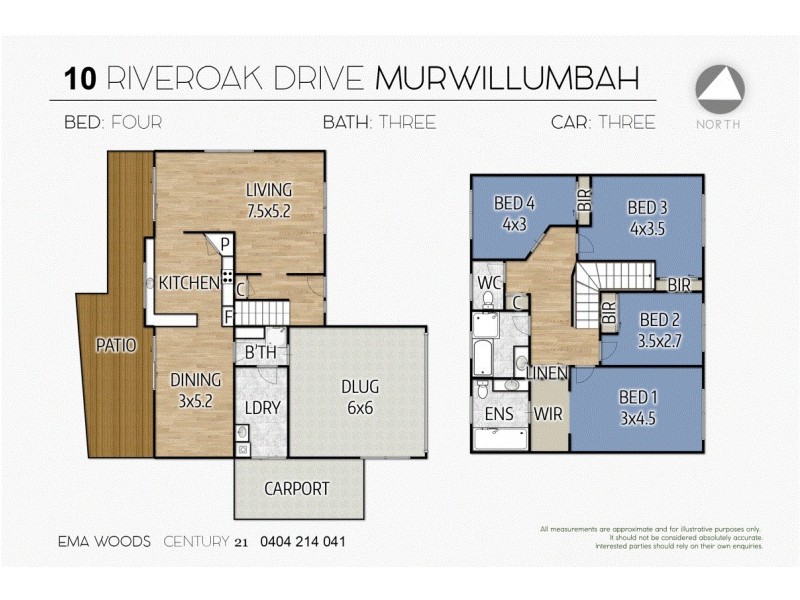
10 Riveroak Drive, Murwillumbah NSW 2484
OWNERS WANTING QUICK SALE NOW !!!
UNDER CONTRACT
- Listing history:
- 17 Dec, 2013
- 16 Oct, 2017

- 4
- 3
- 3
OWNERS WANTING QUICK SALE NOW !!!


Listing ID: 34992823